EPAM Systems, Inc.'s management explains the business in its own materials. The slides below do the most of that work, pulled from the documents preserved in Sources. Each source link opens the complete presentation at that slide in a new tab.
Management's fullest current statement of what EPAM is, how it makes money, and its strategy, market and financial targets for the AI era. · Open the full document →
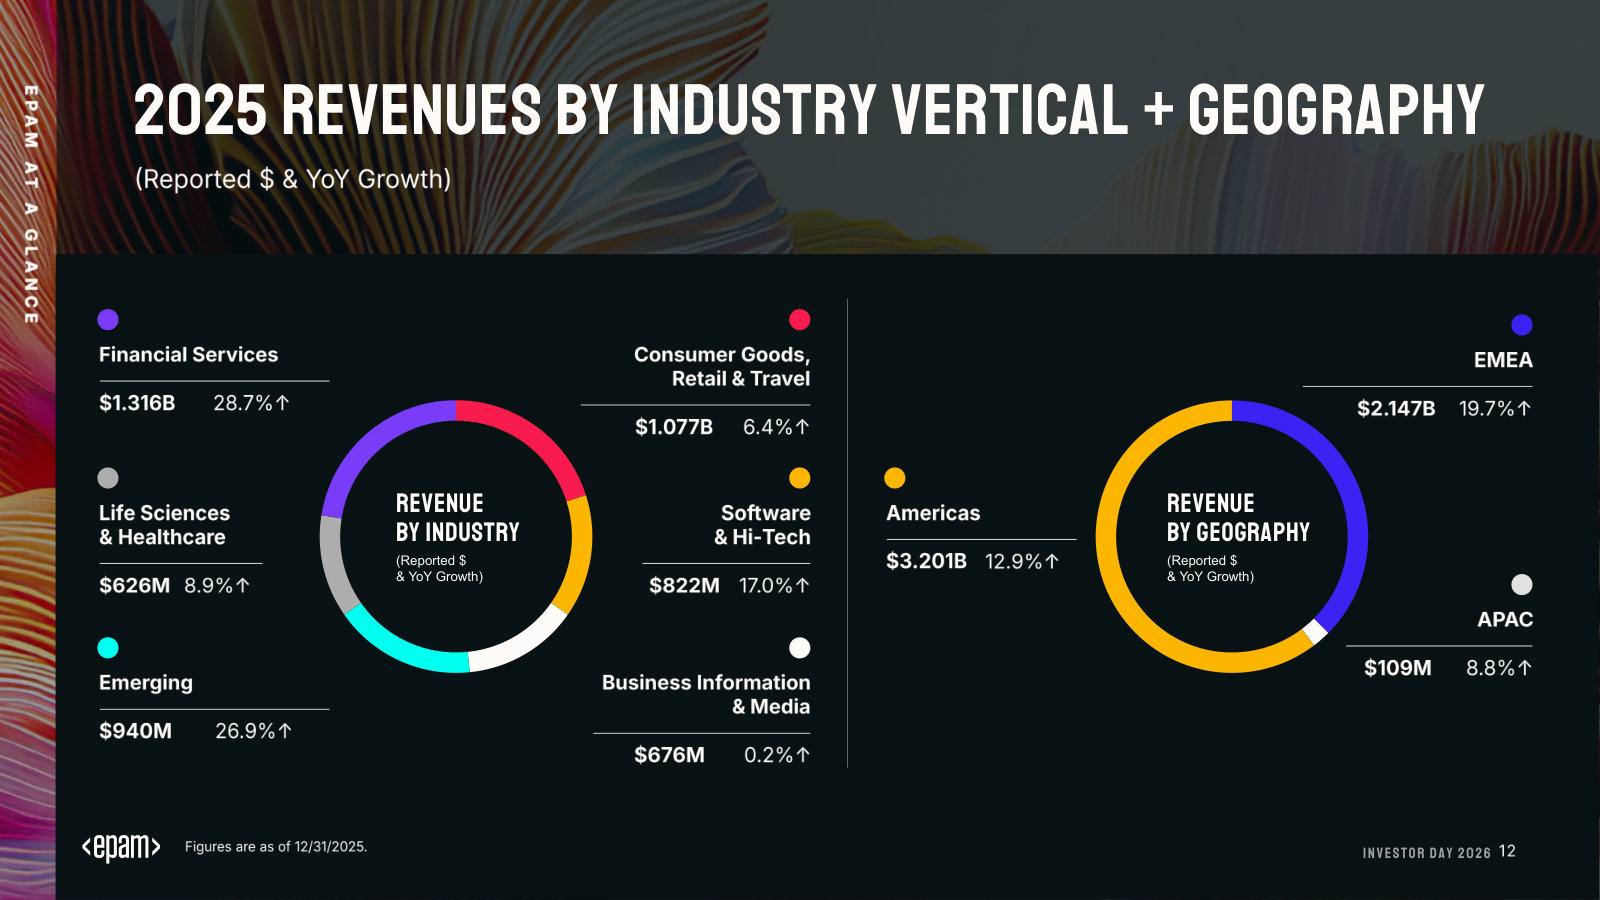
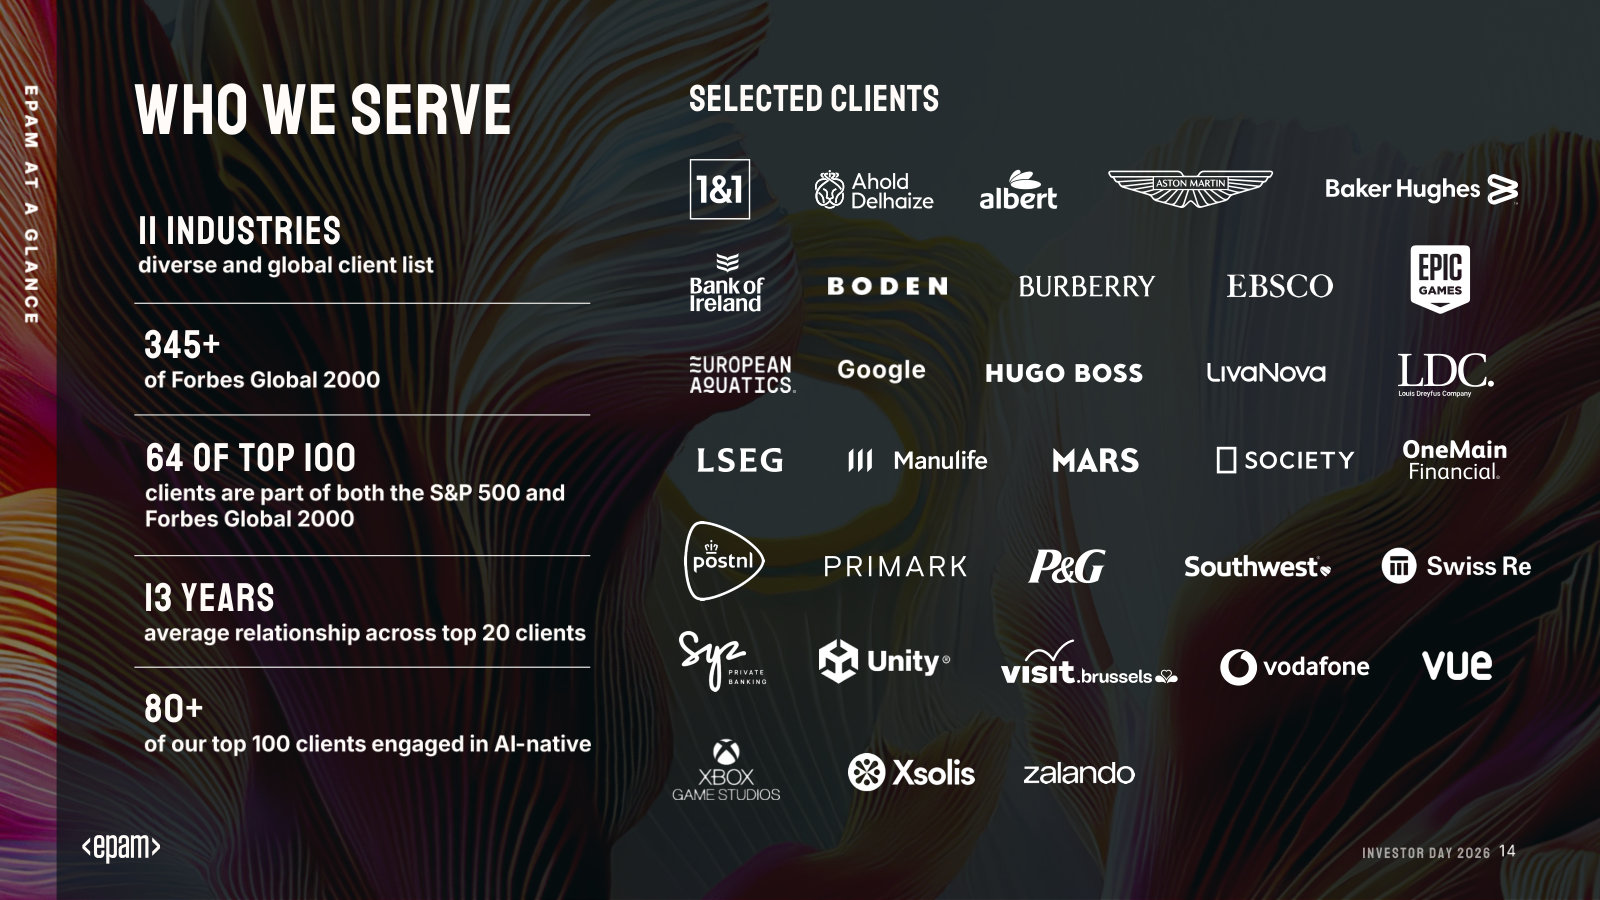
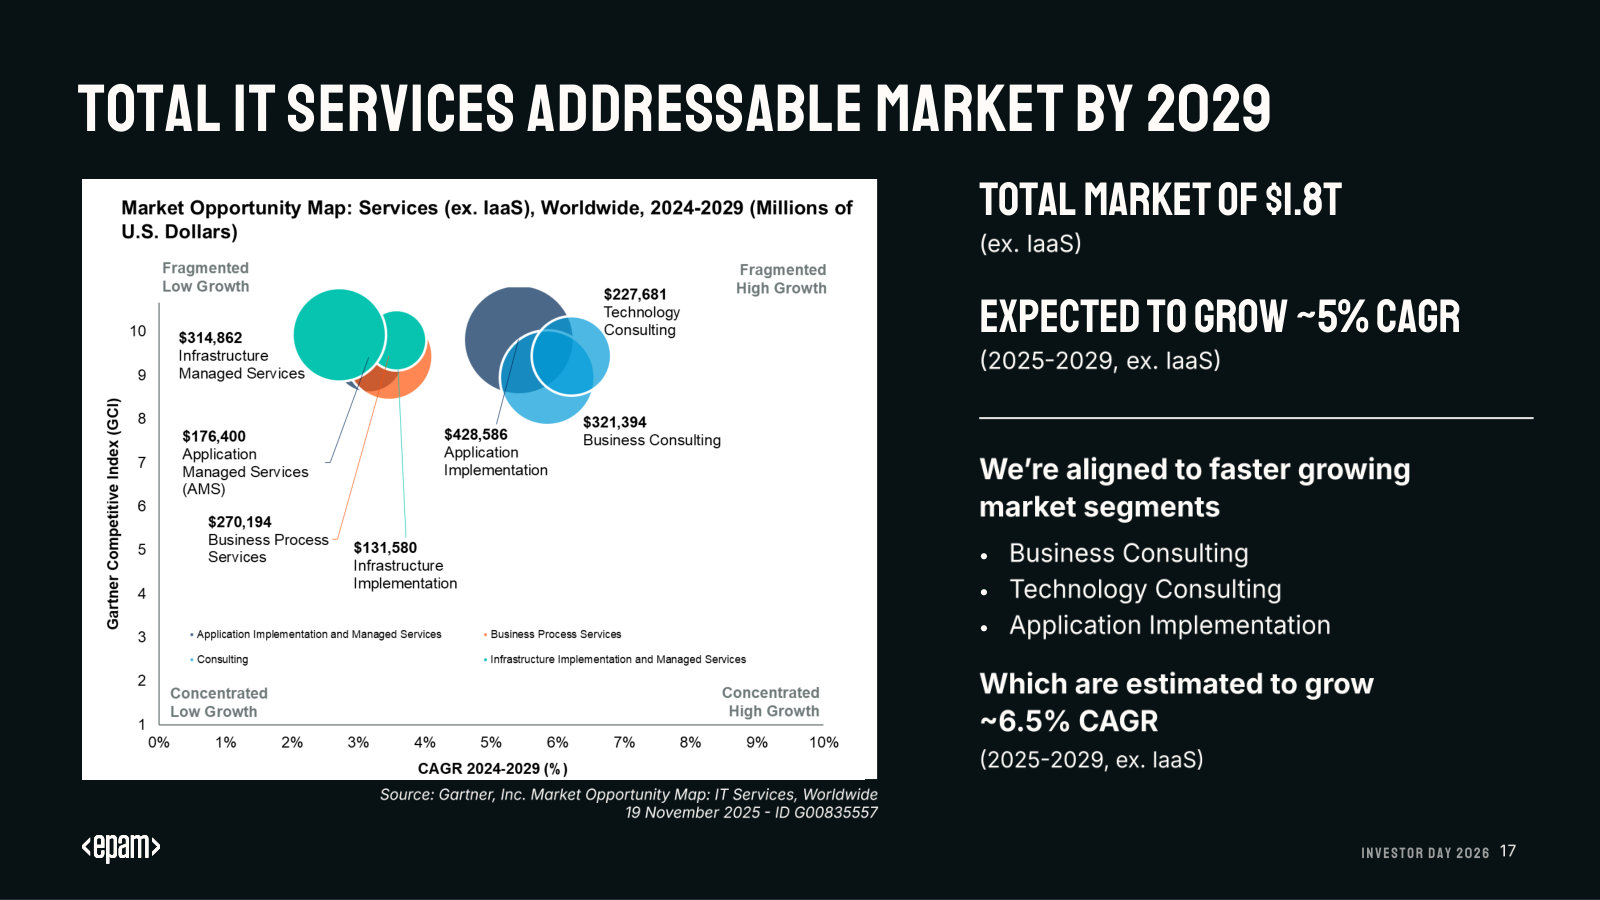
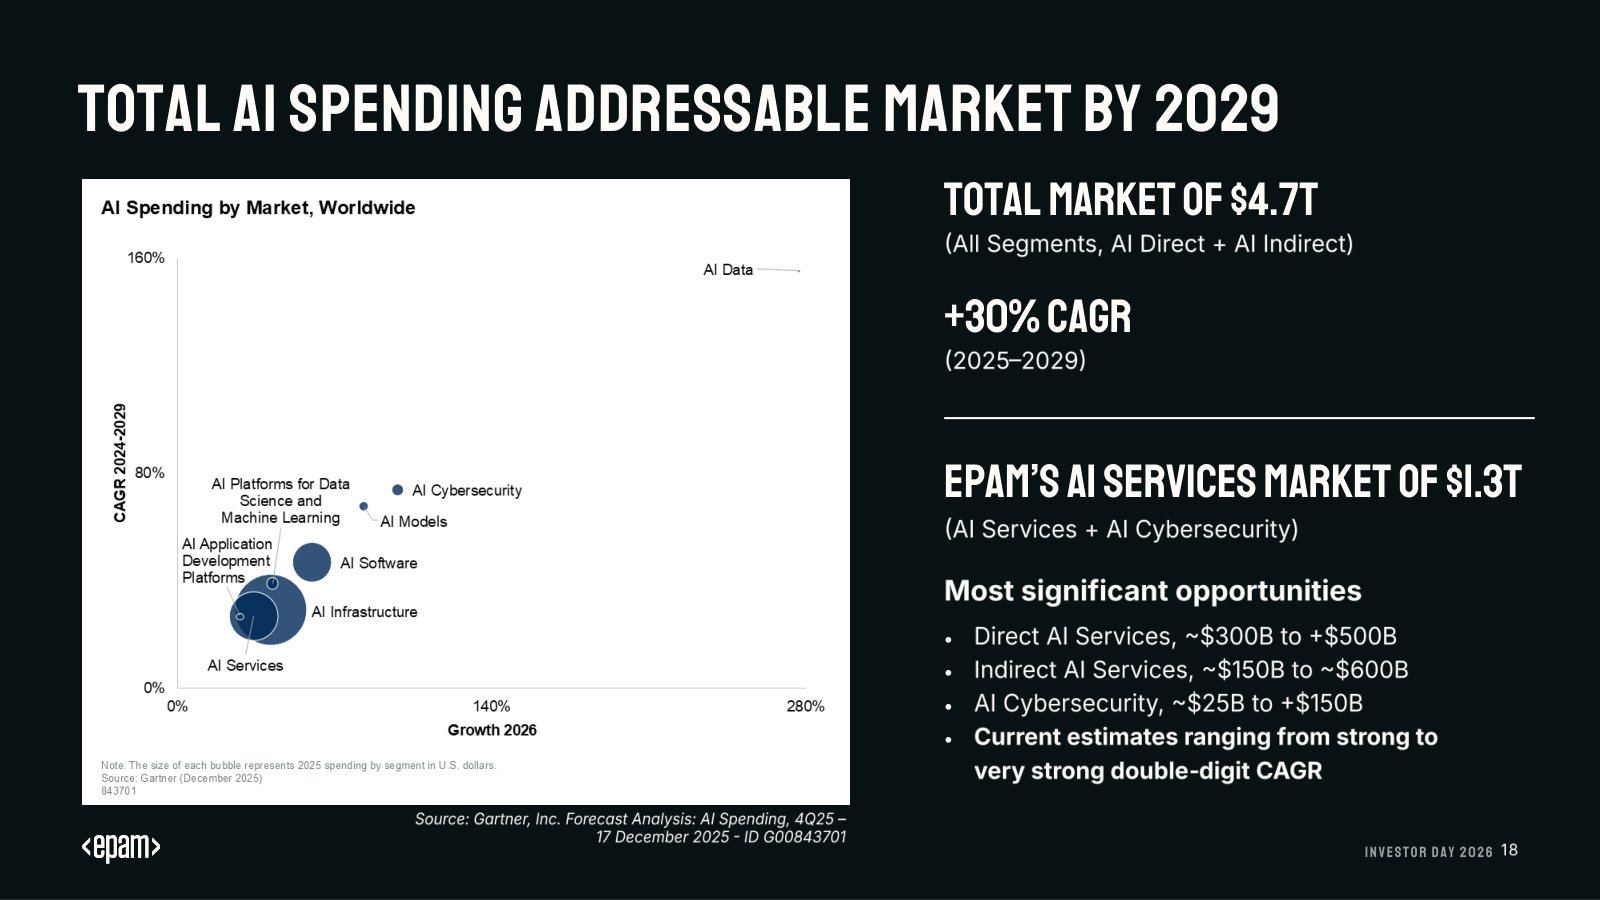
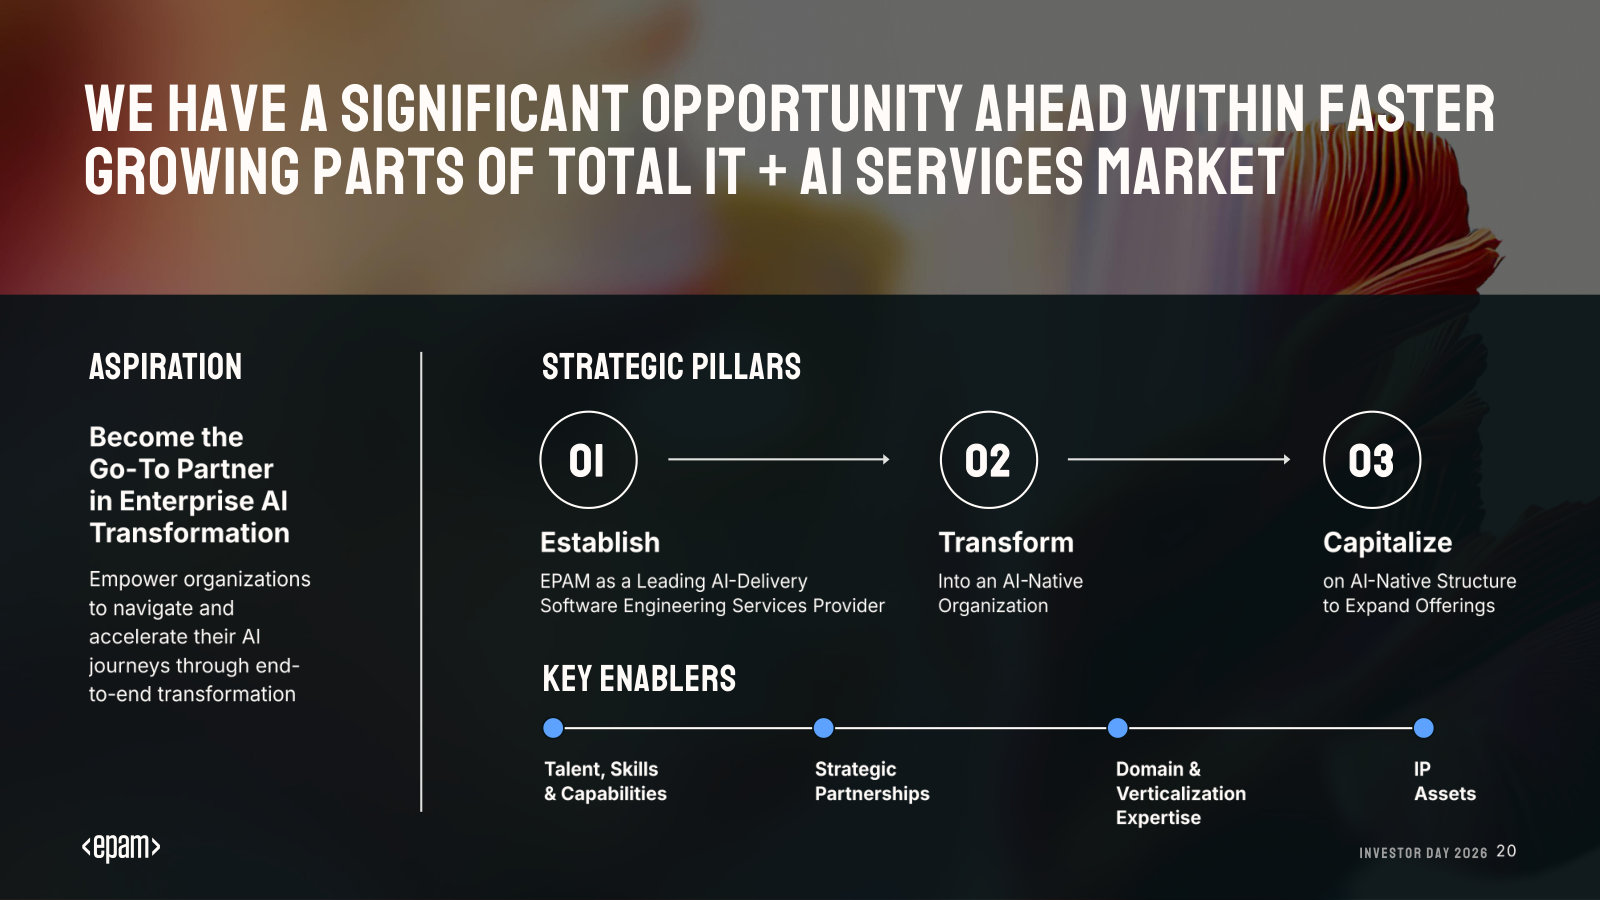
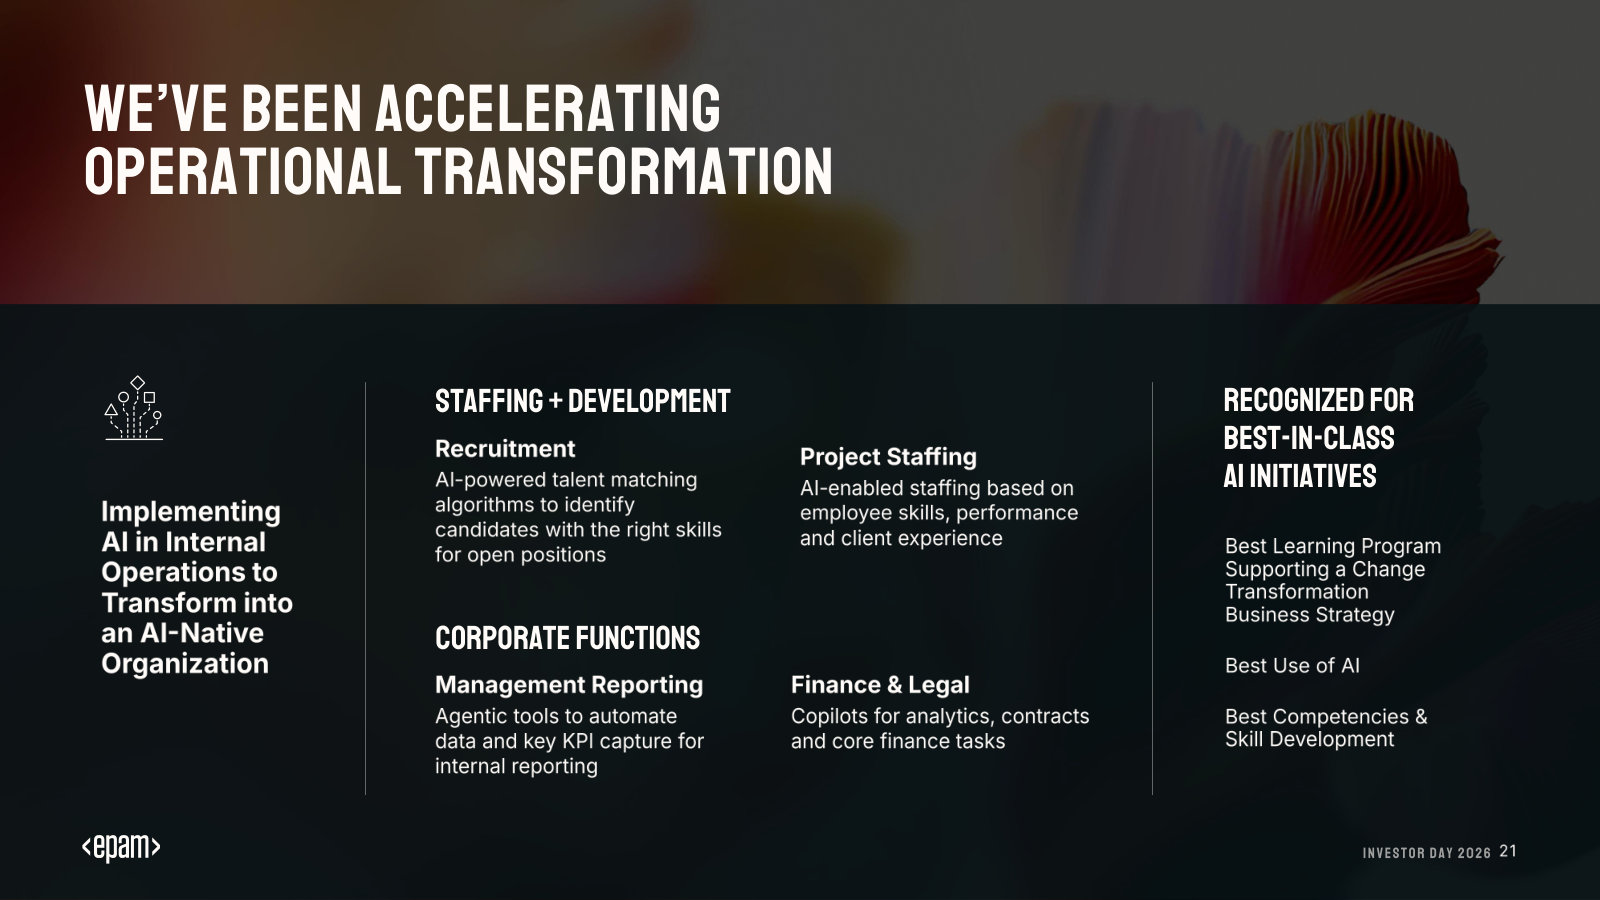
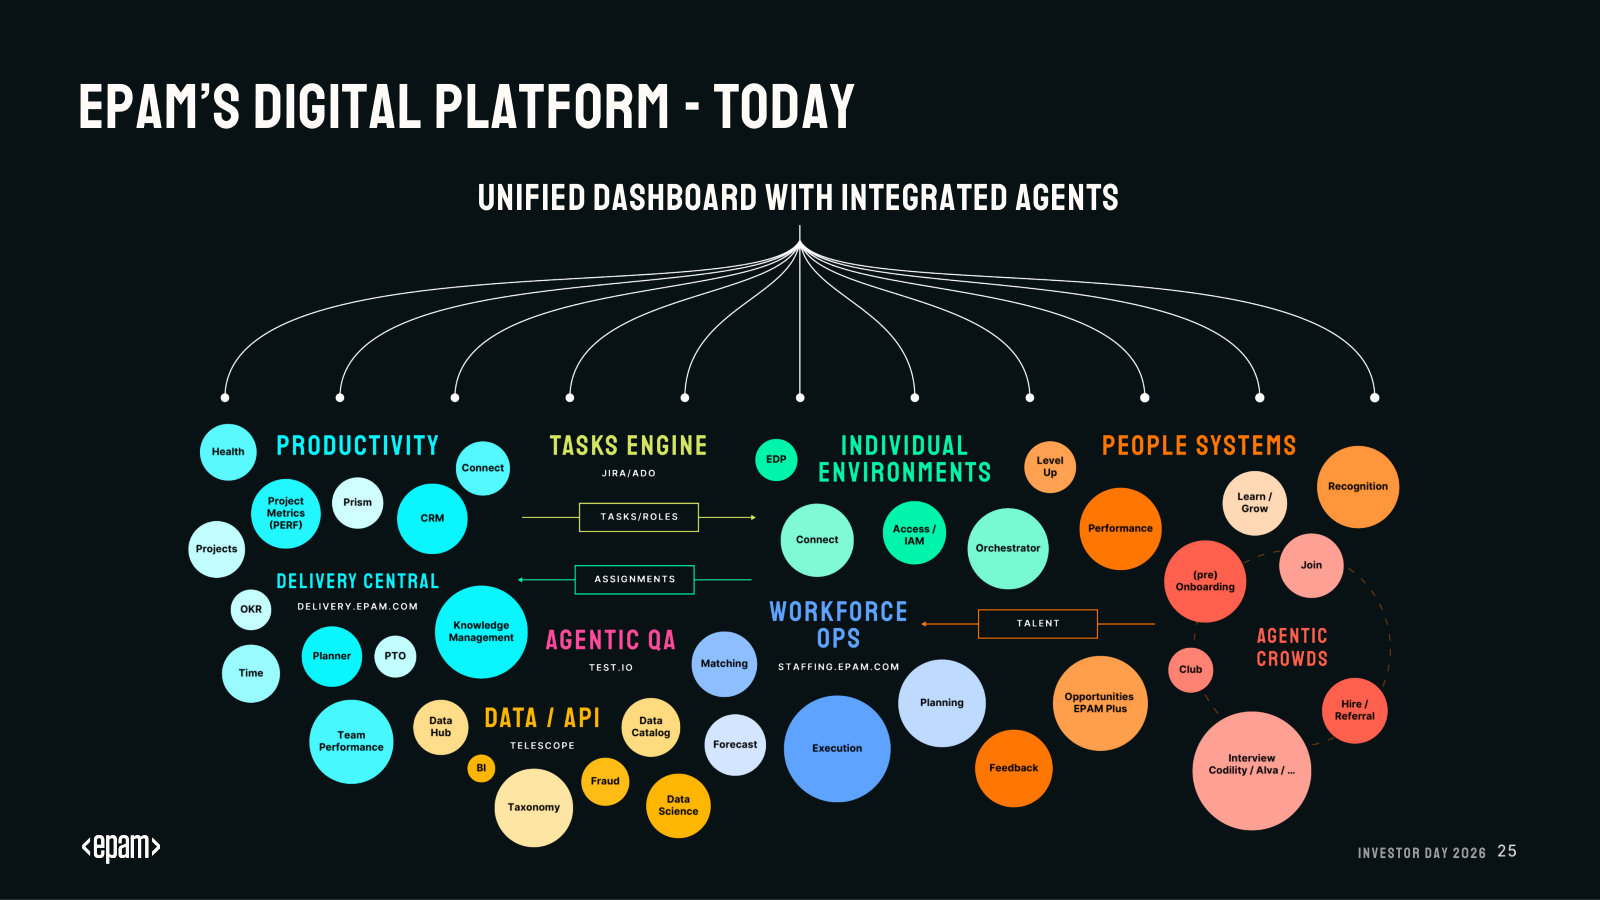
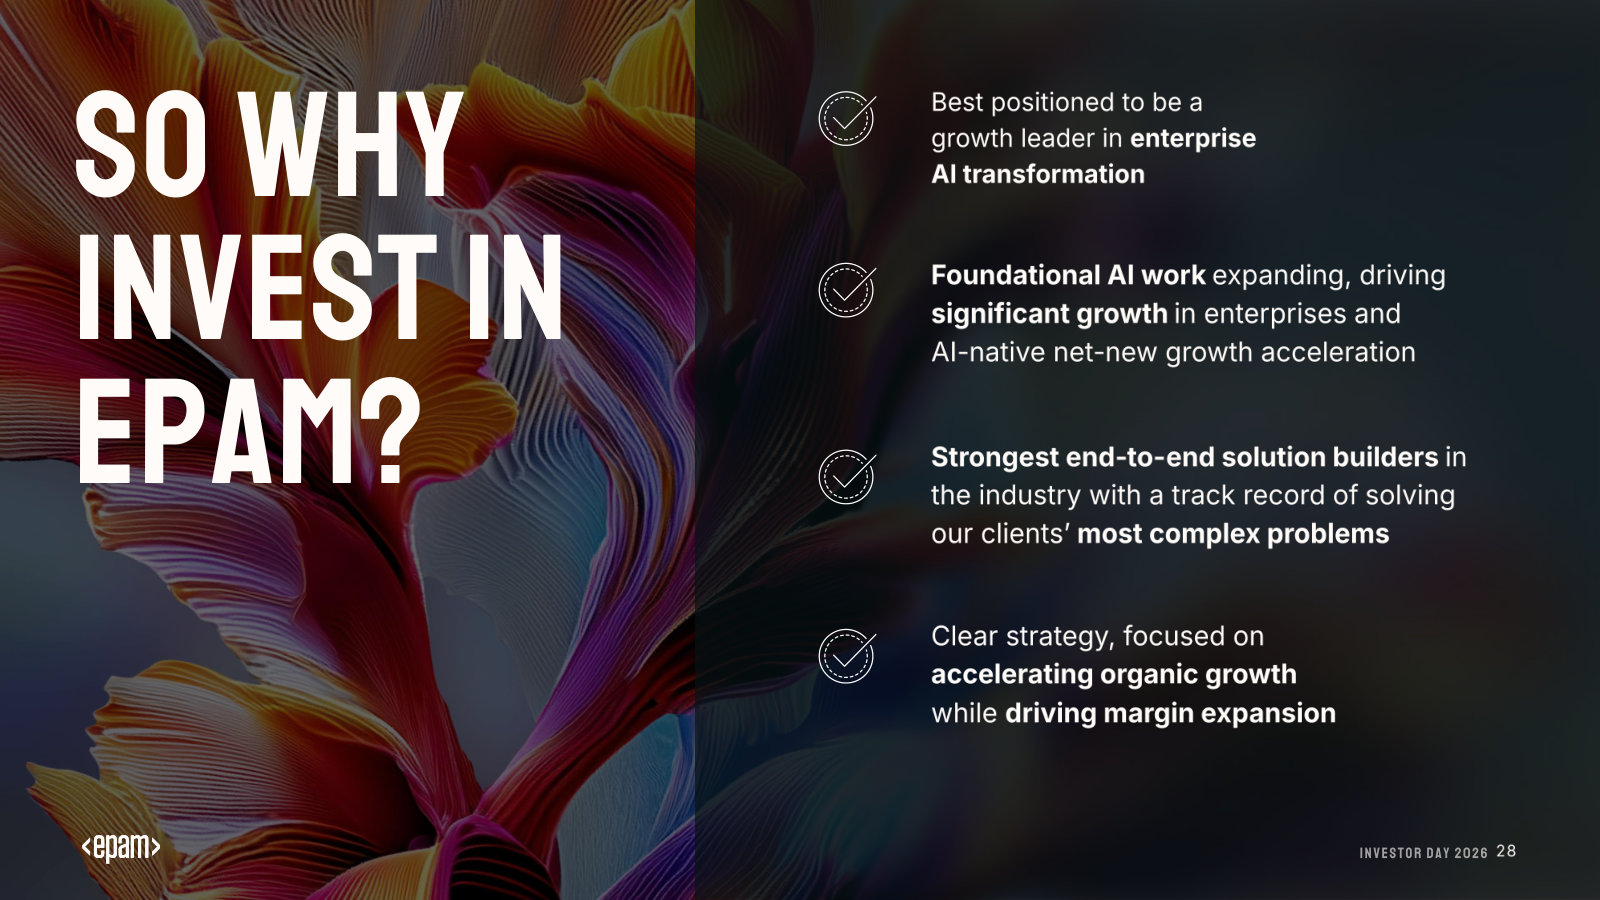
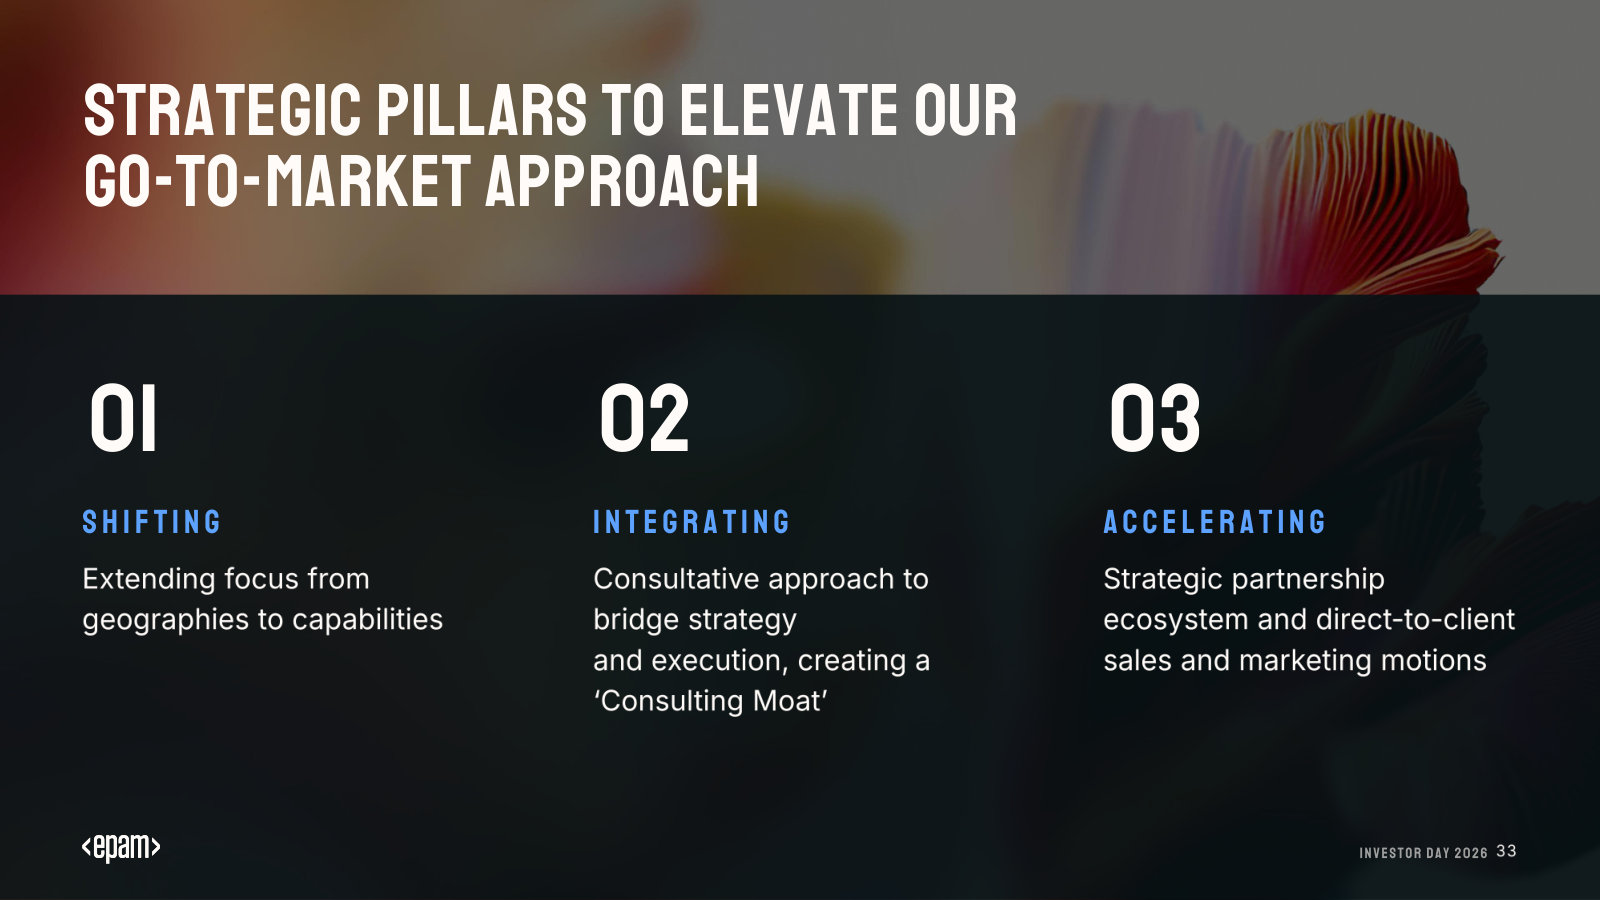
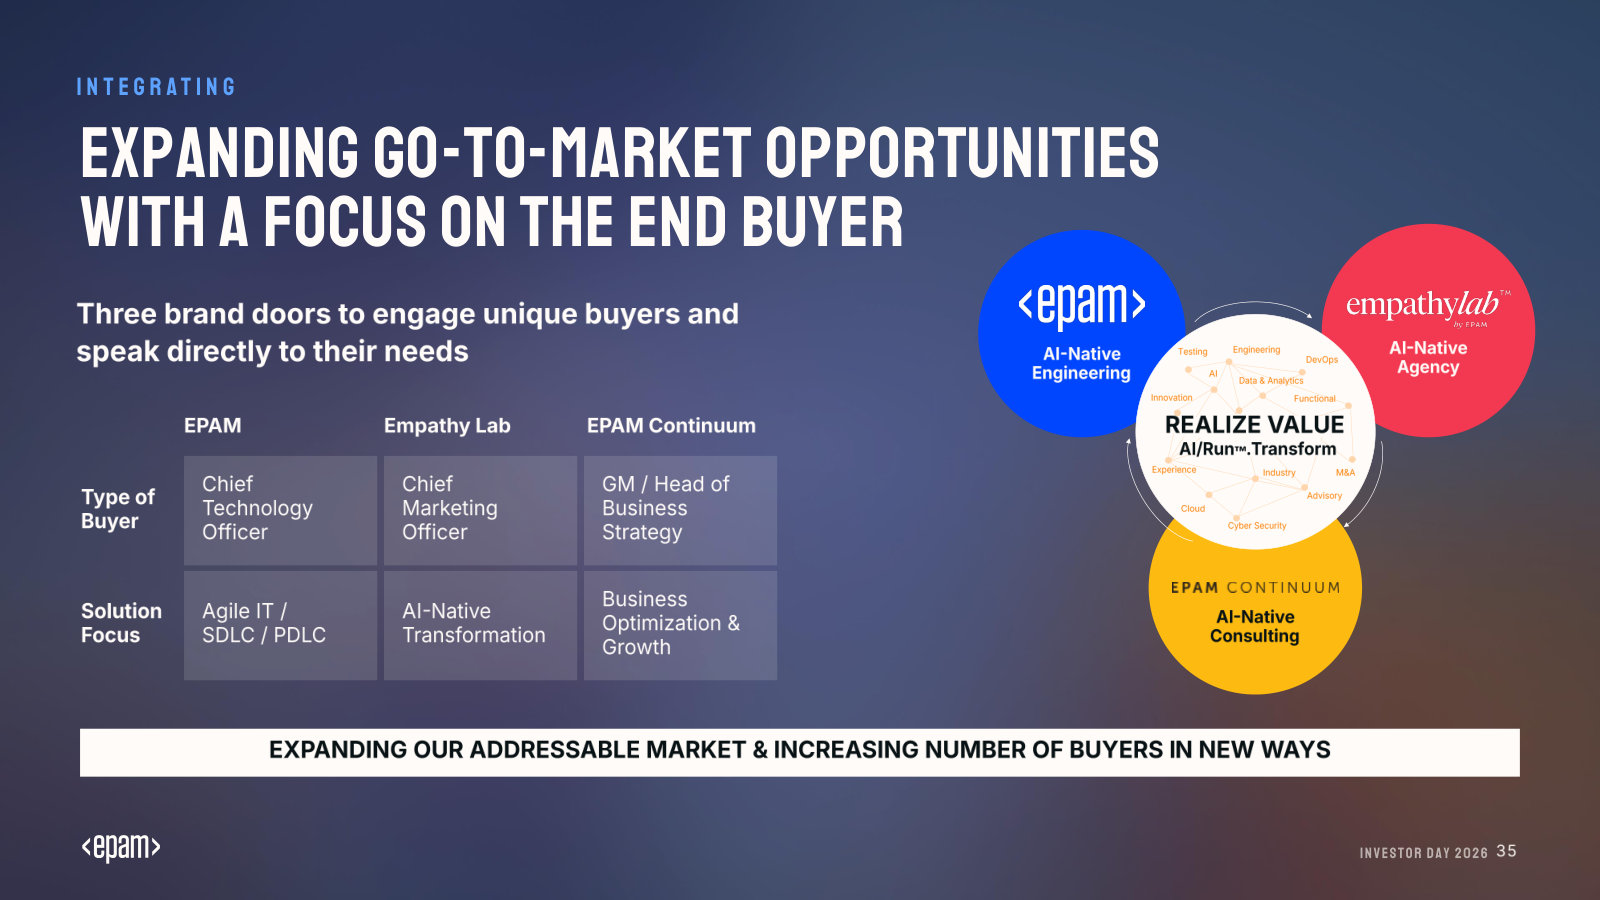
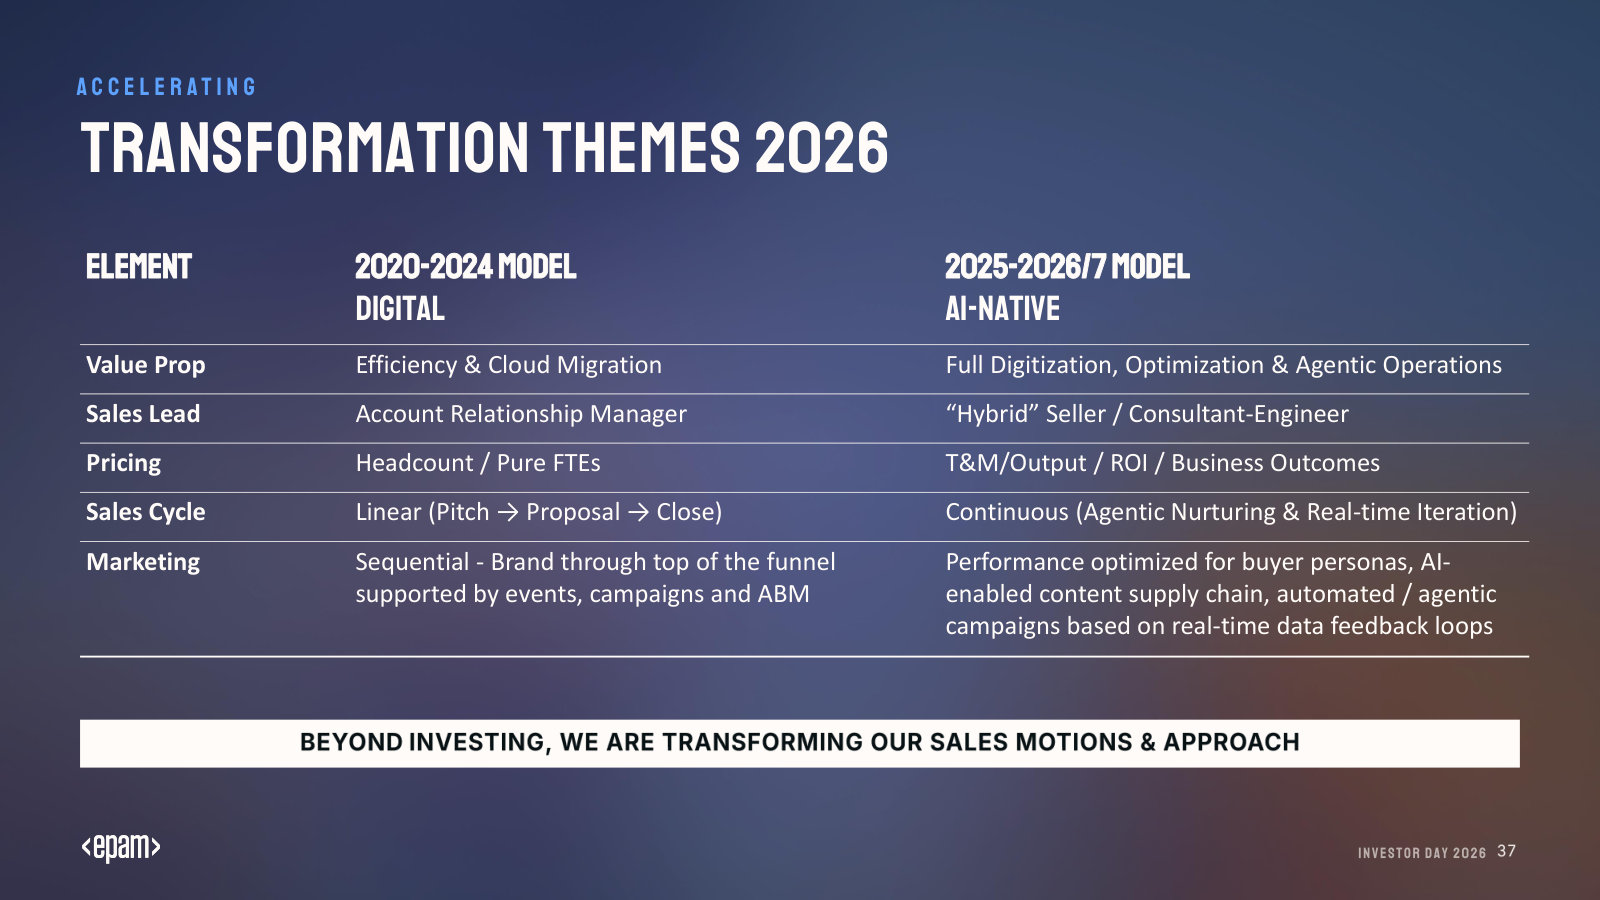
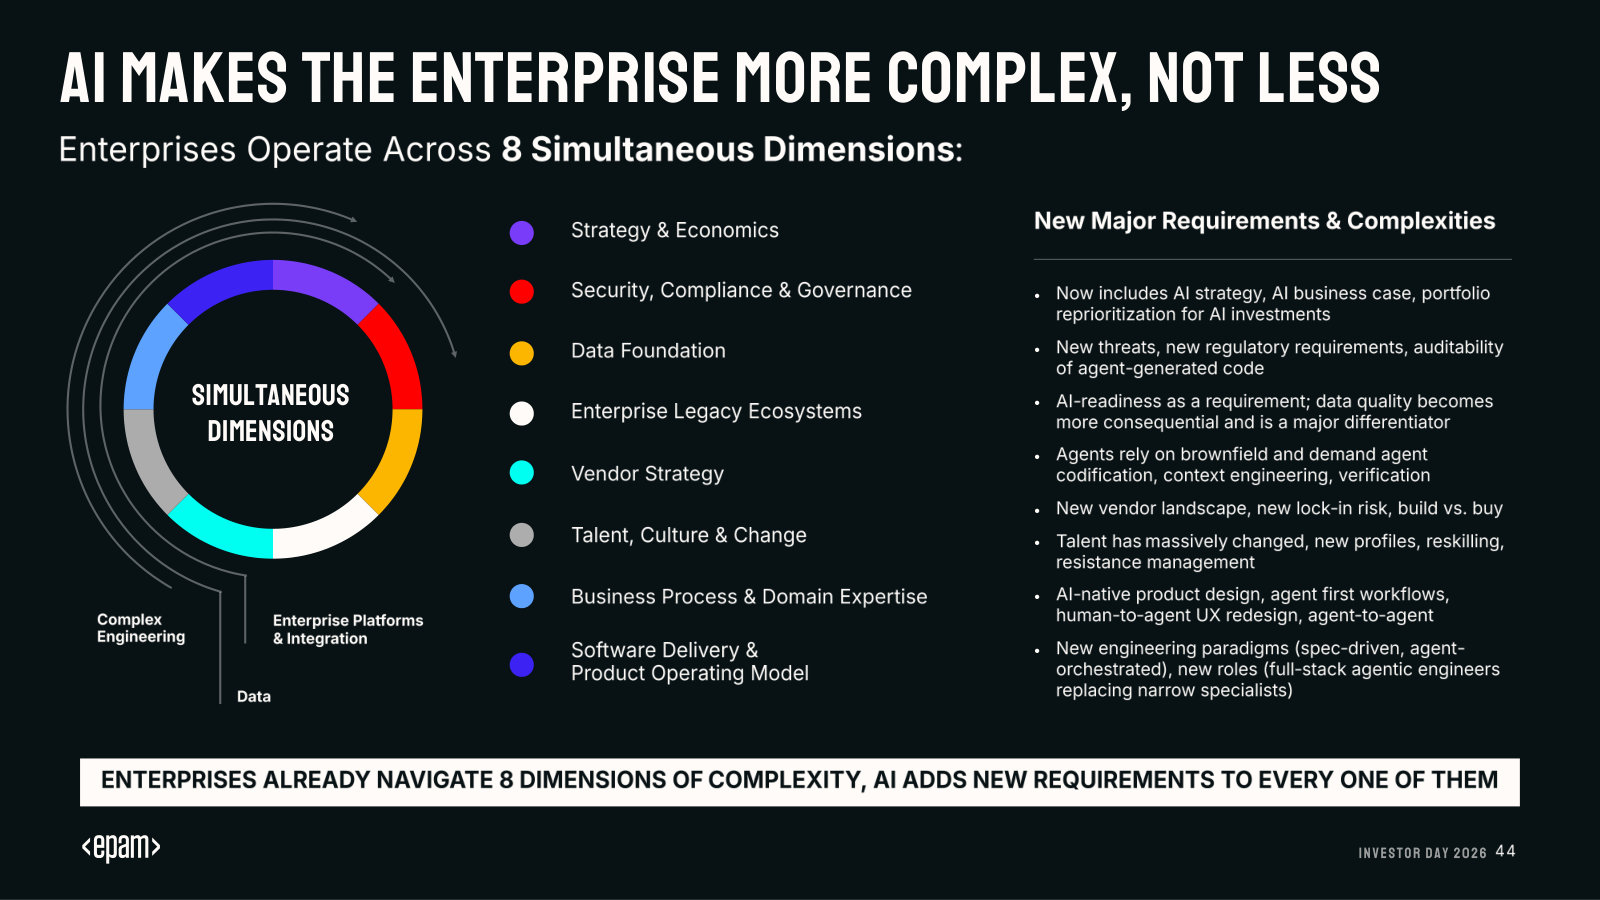
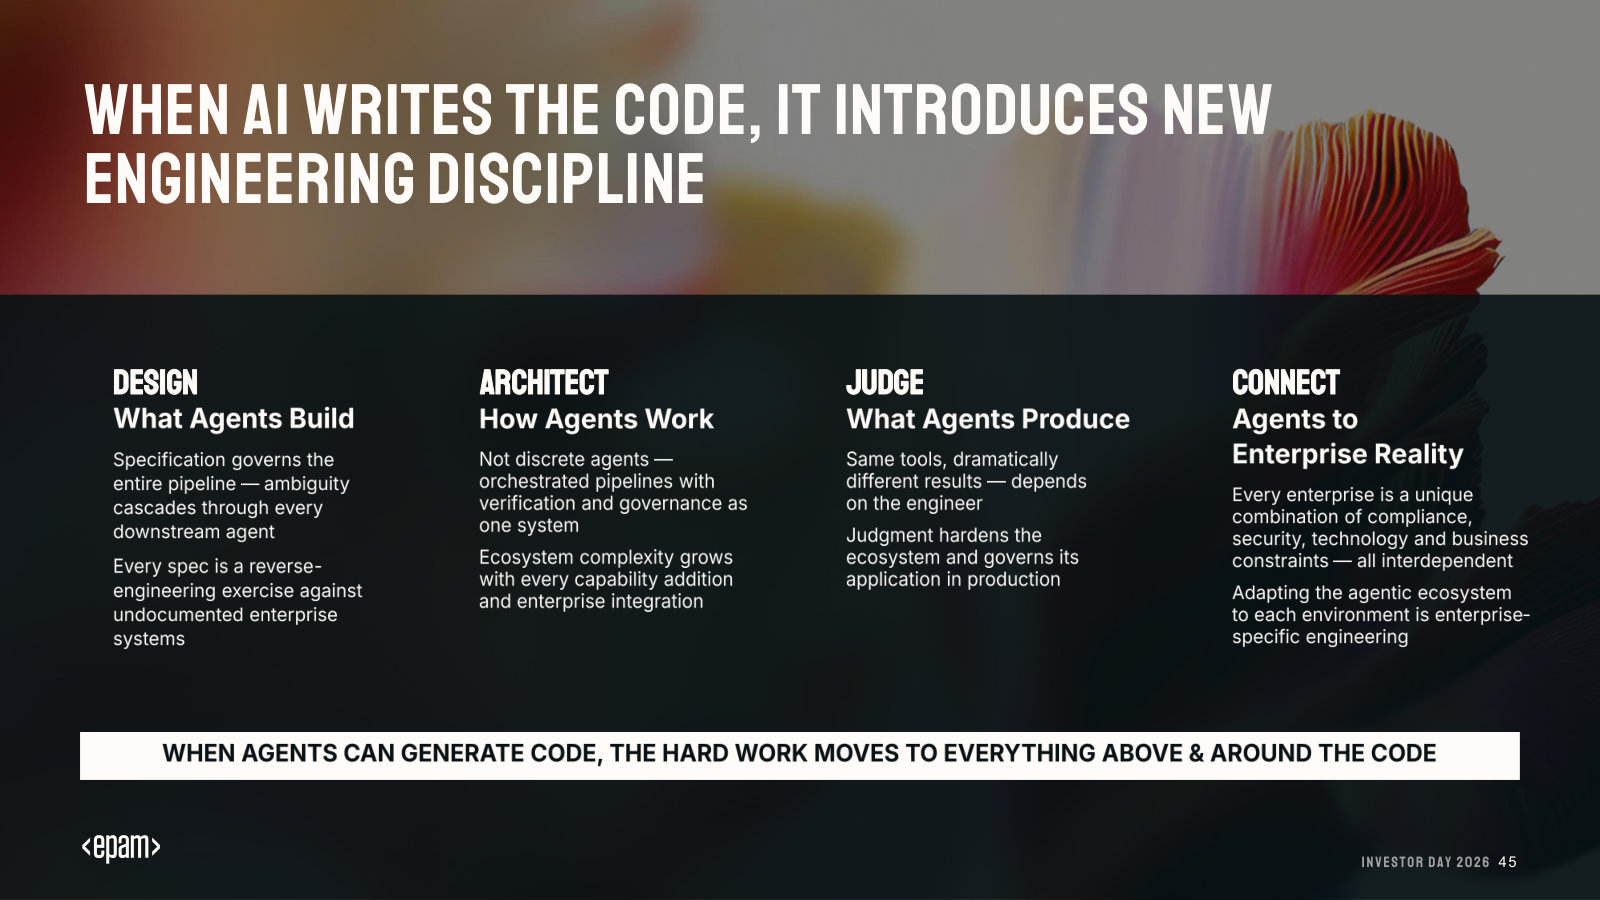
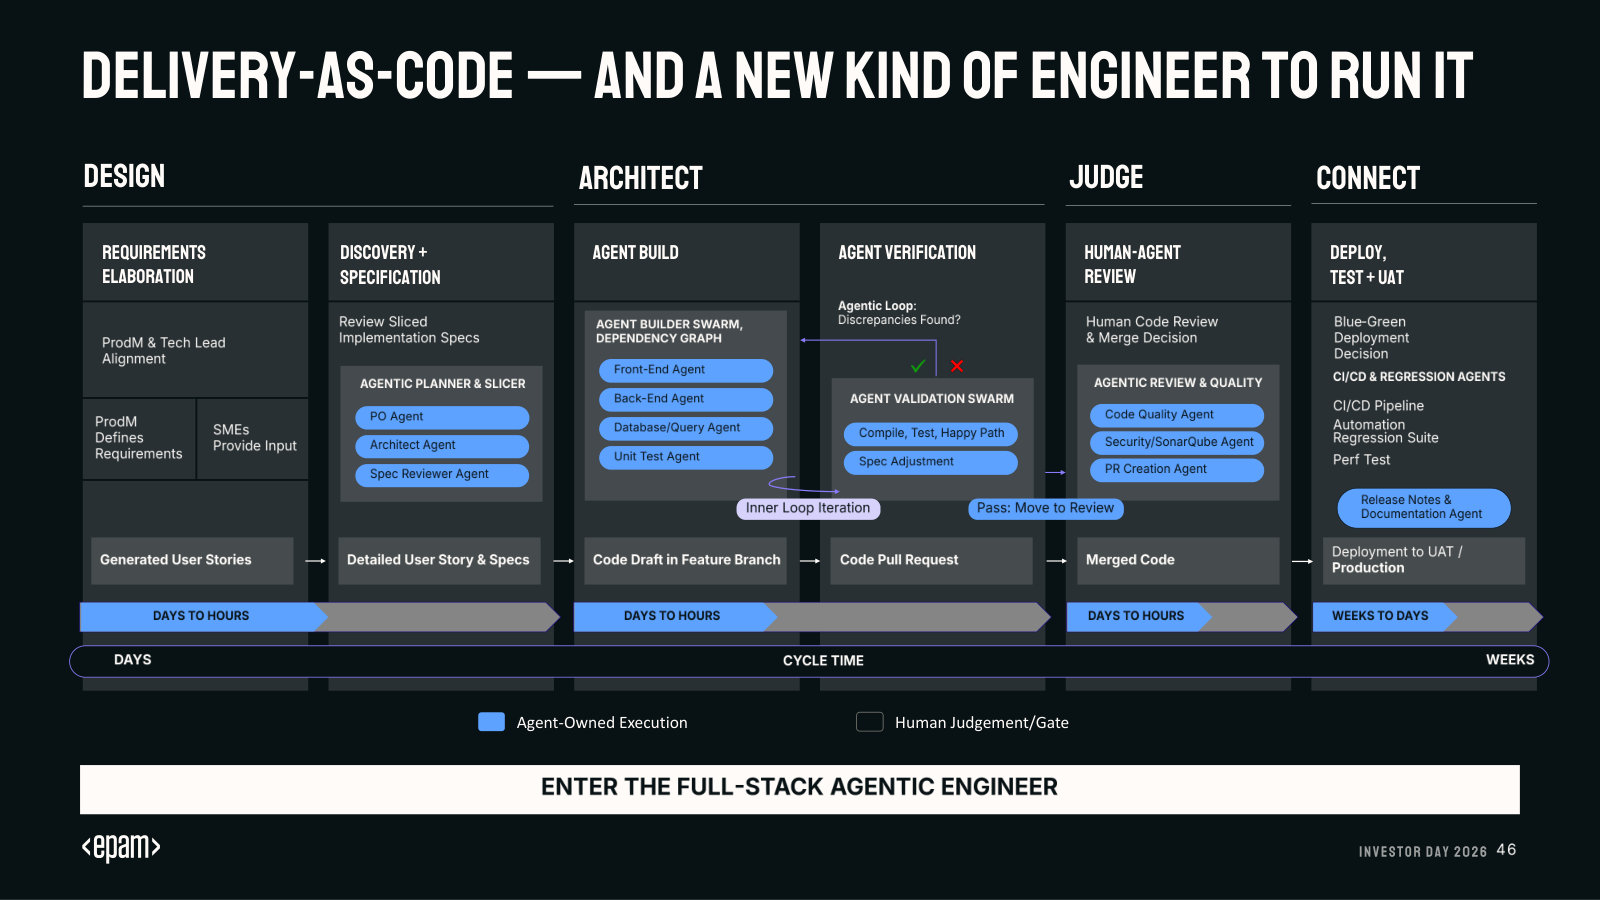
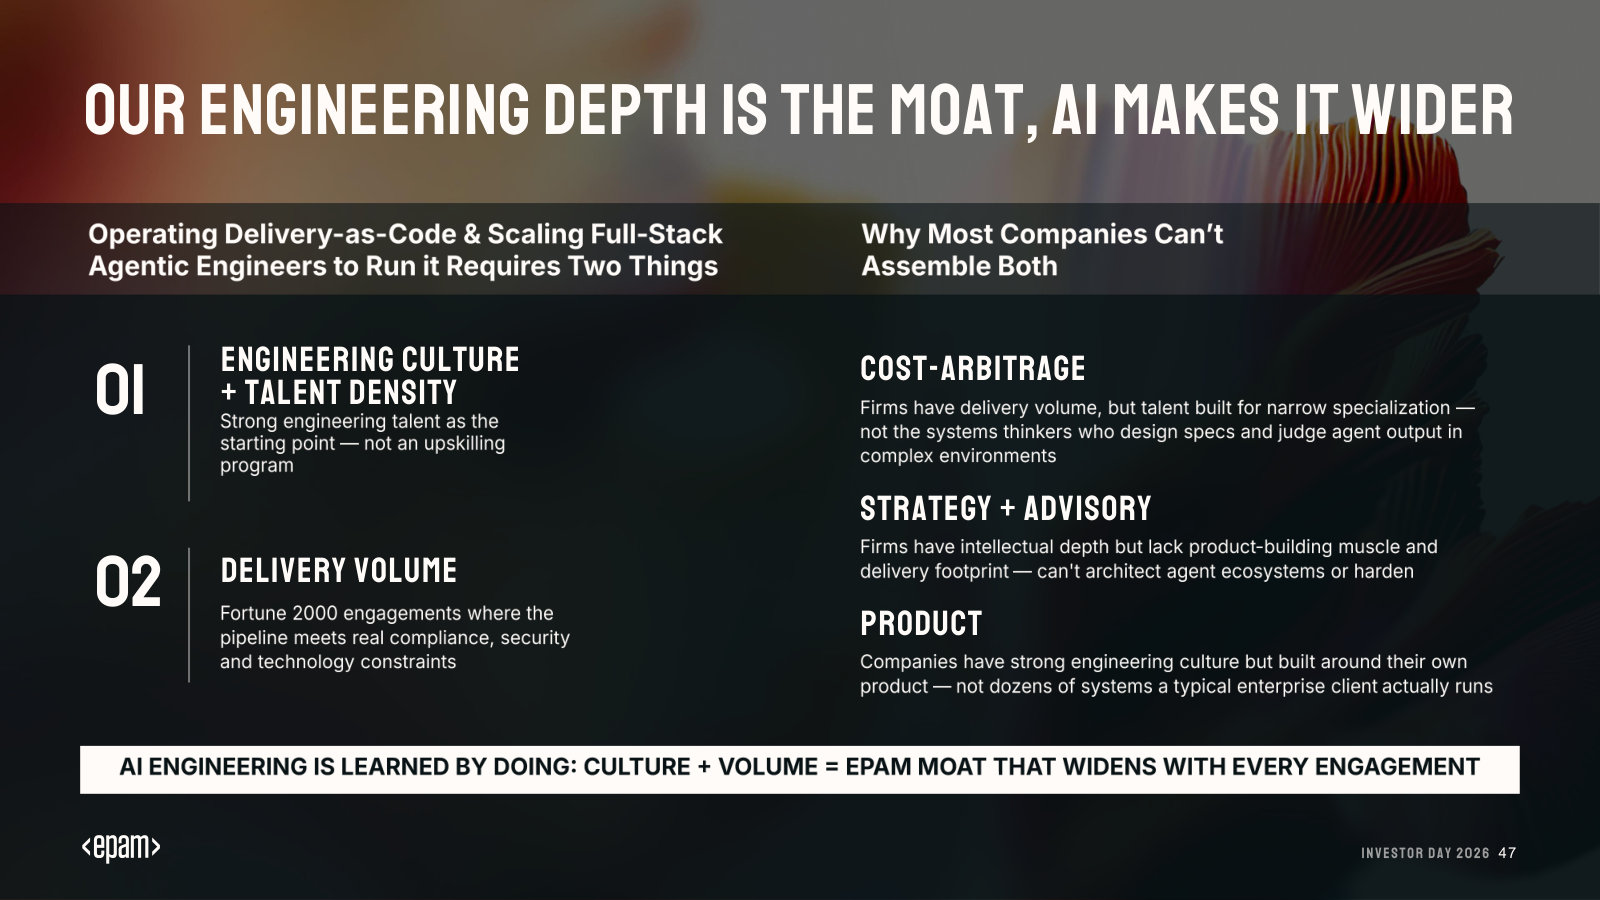
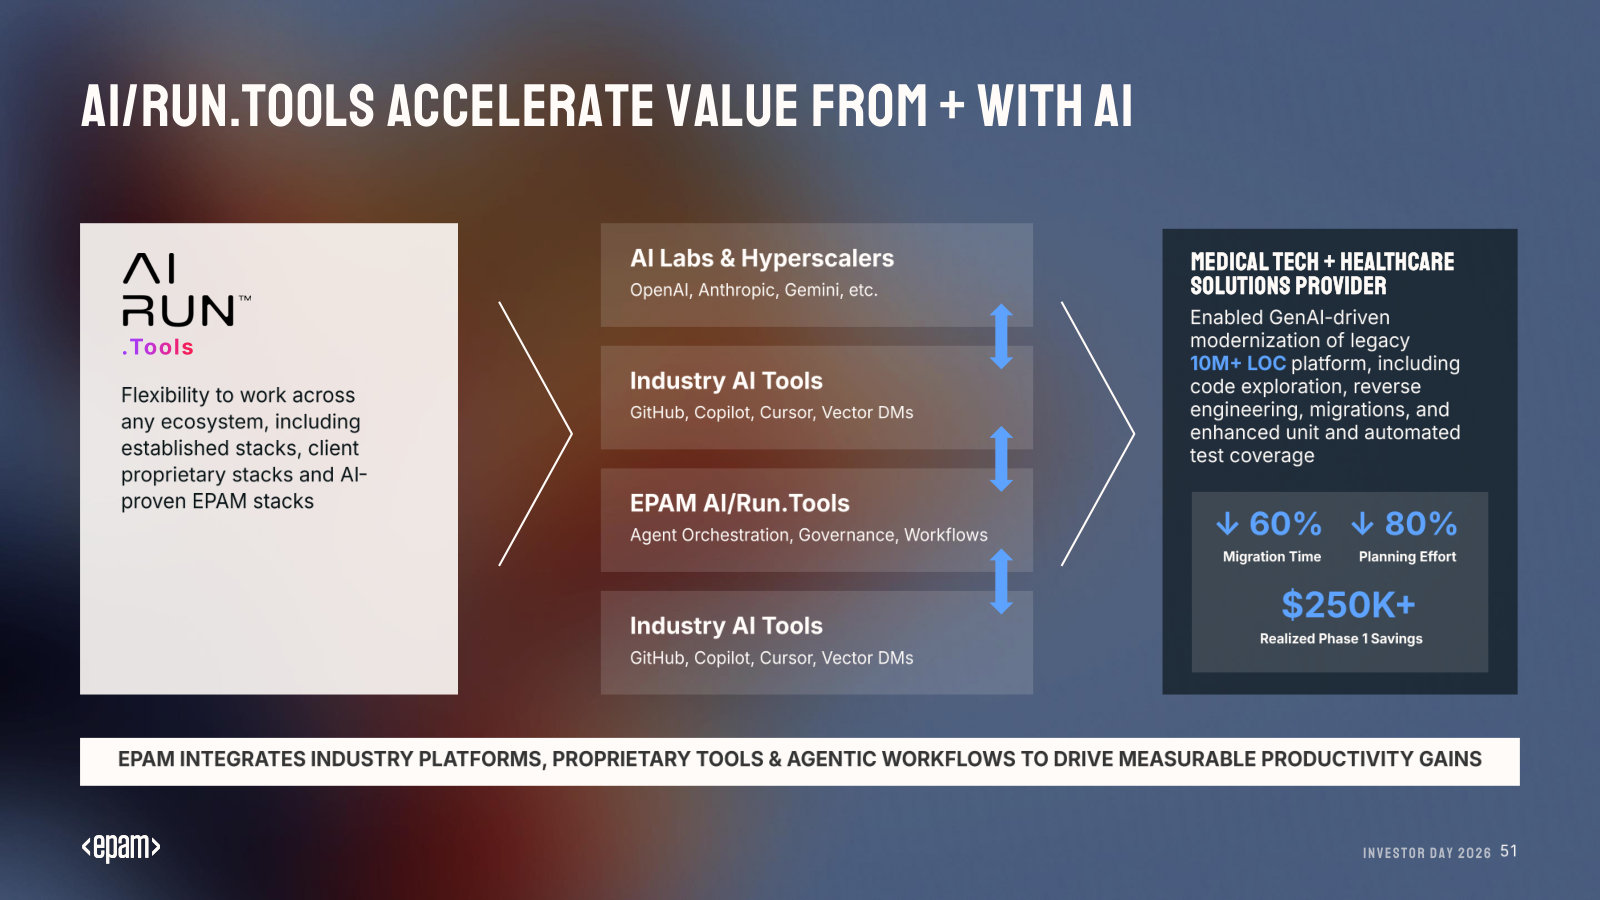
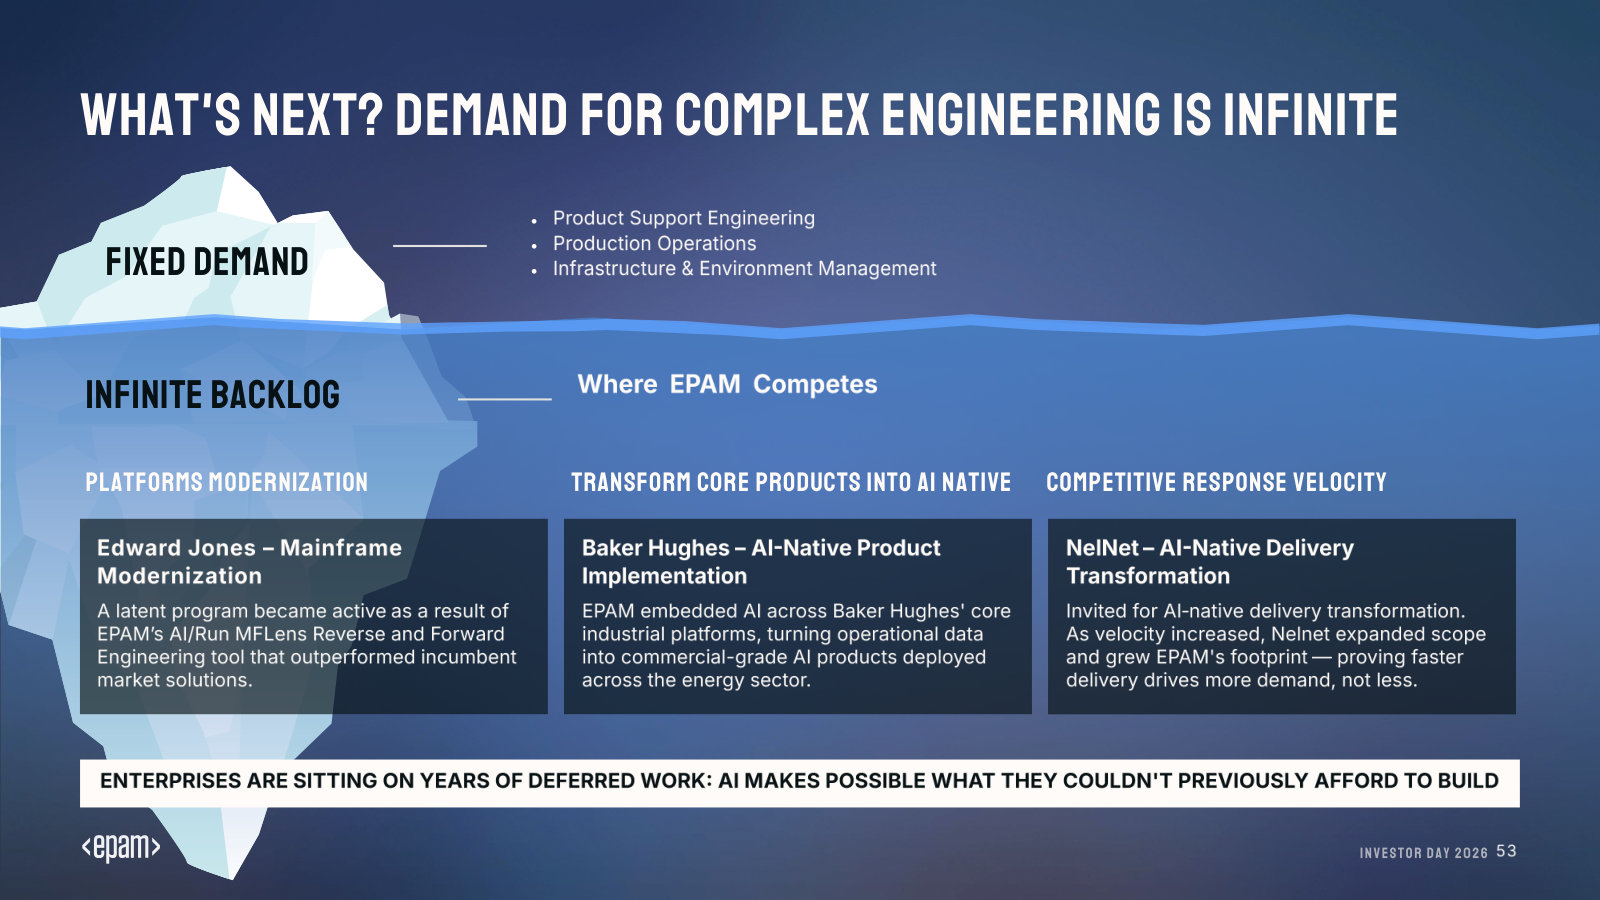
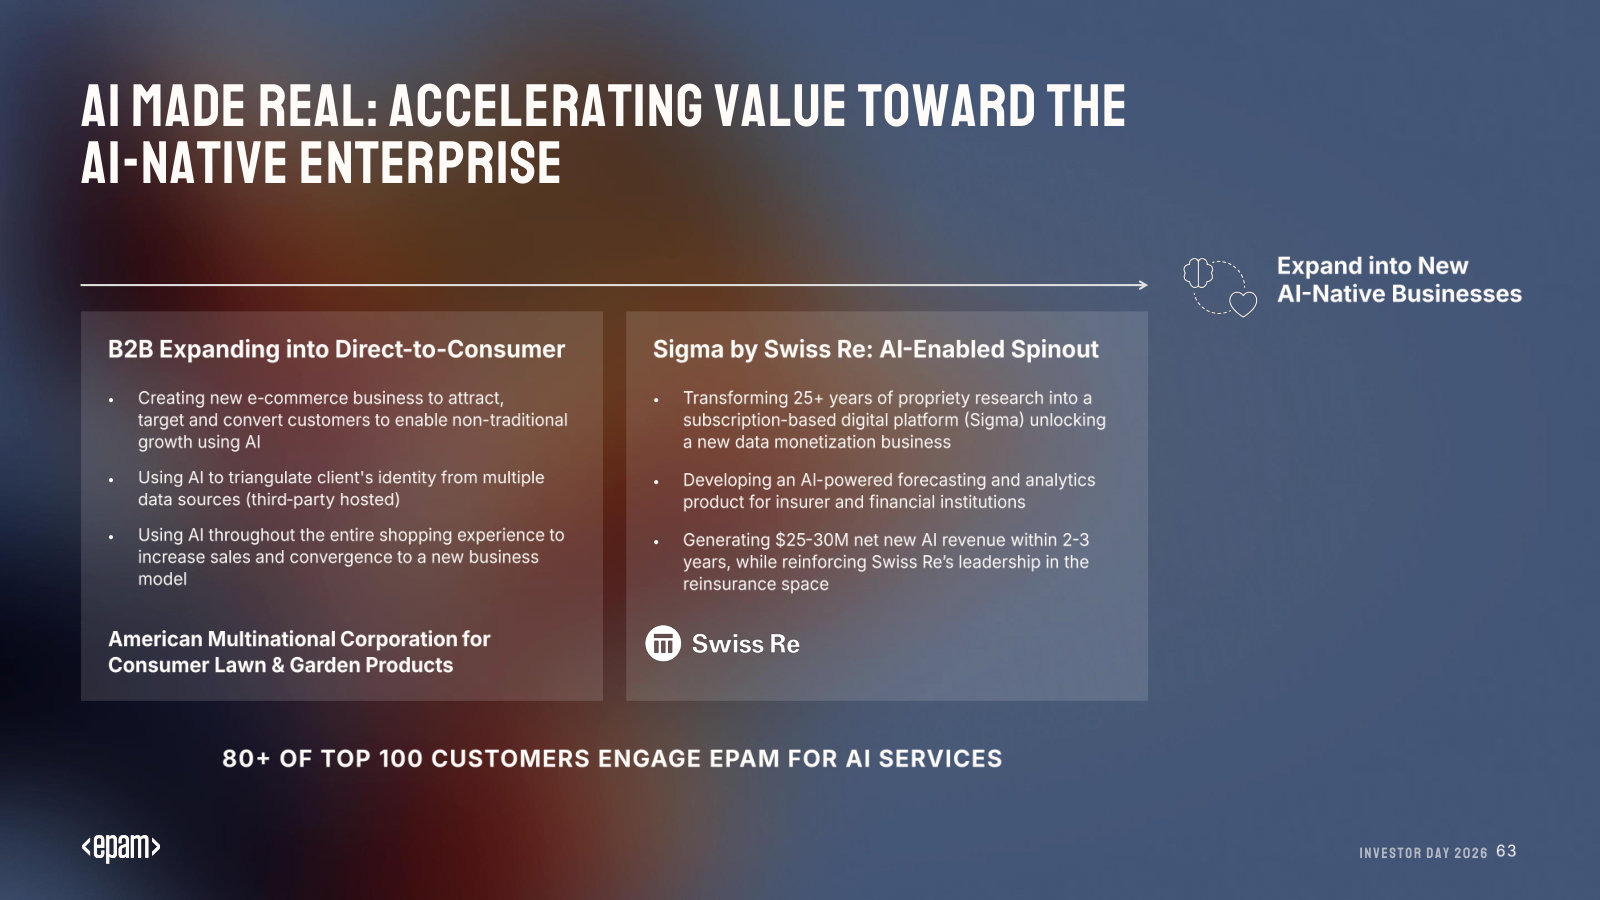
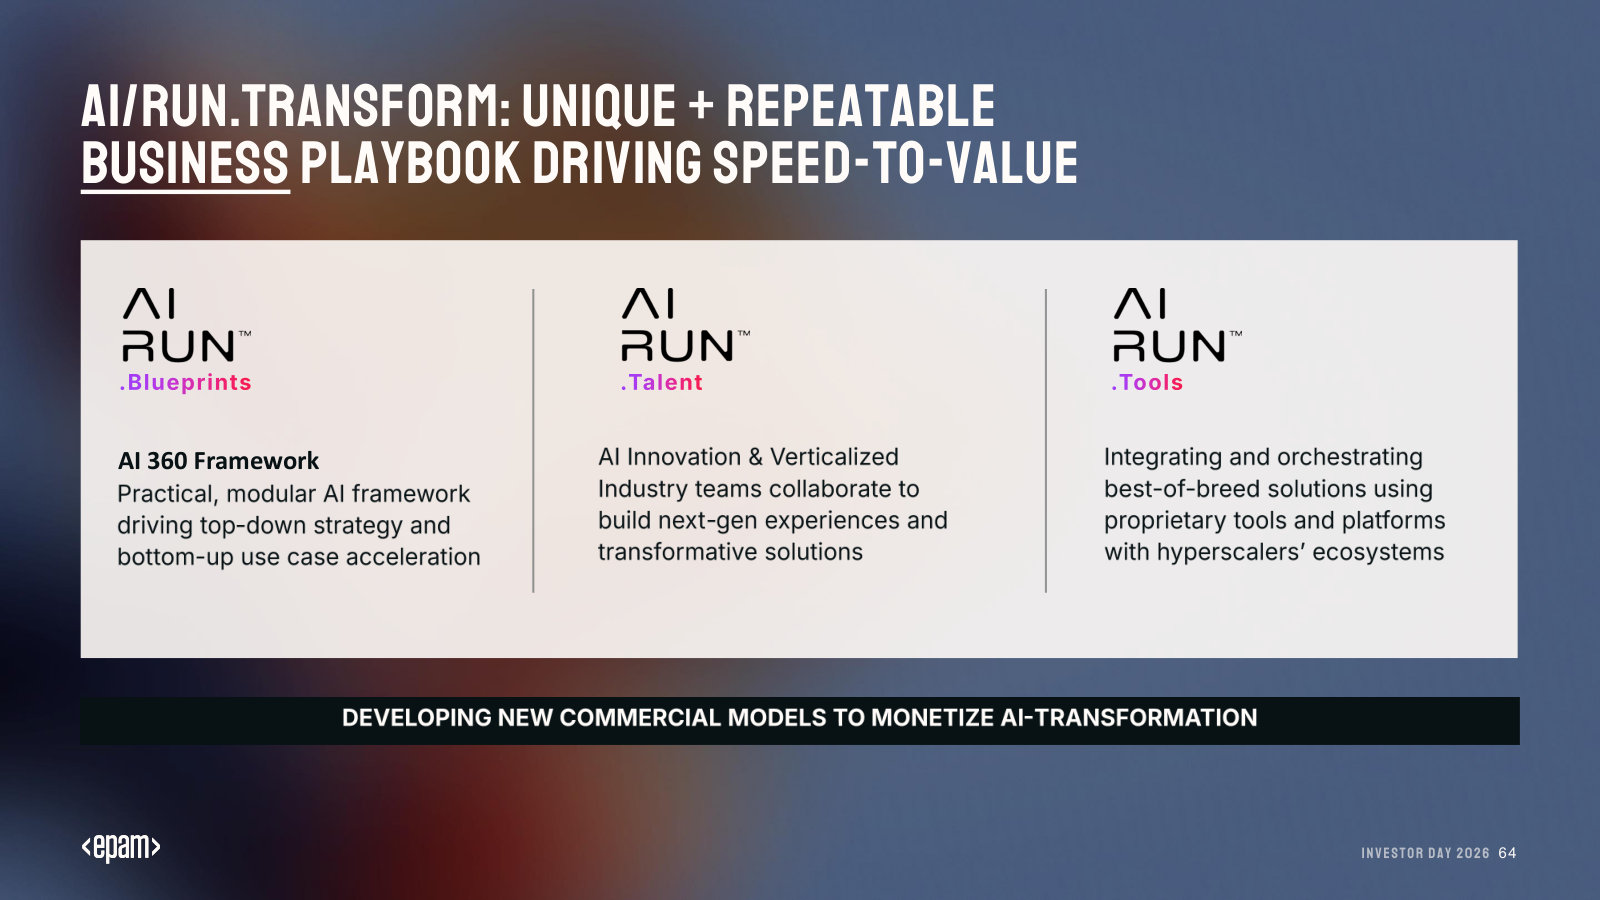
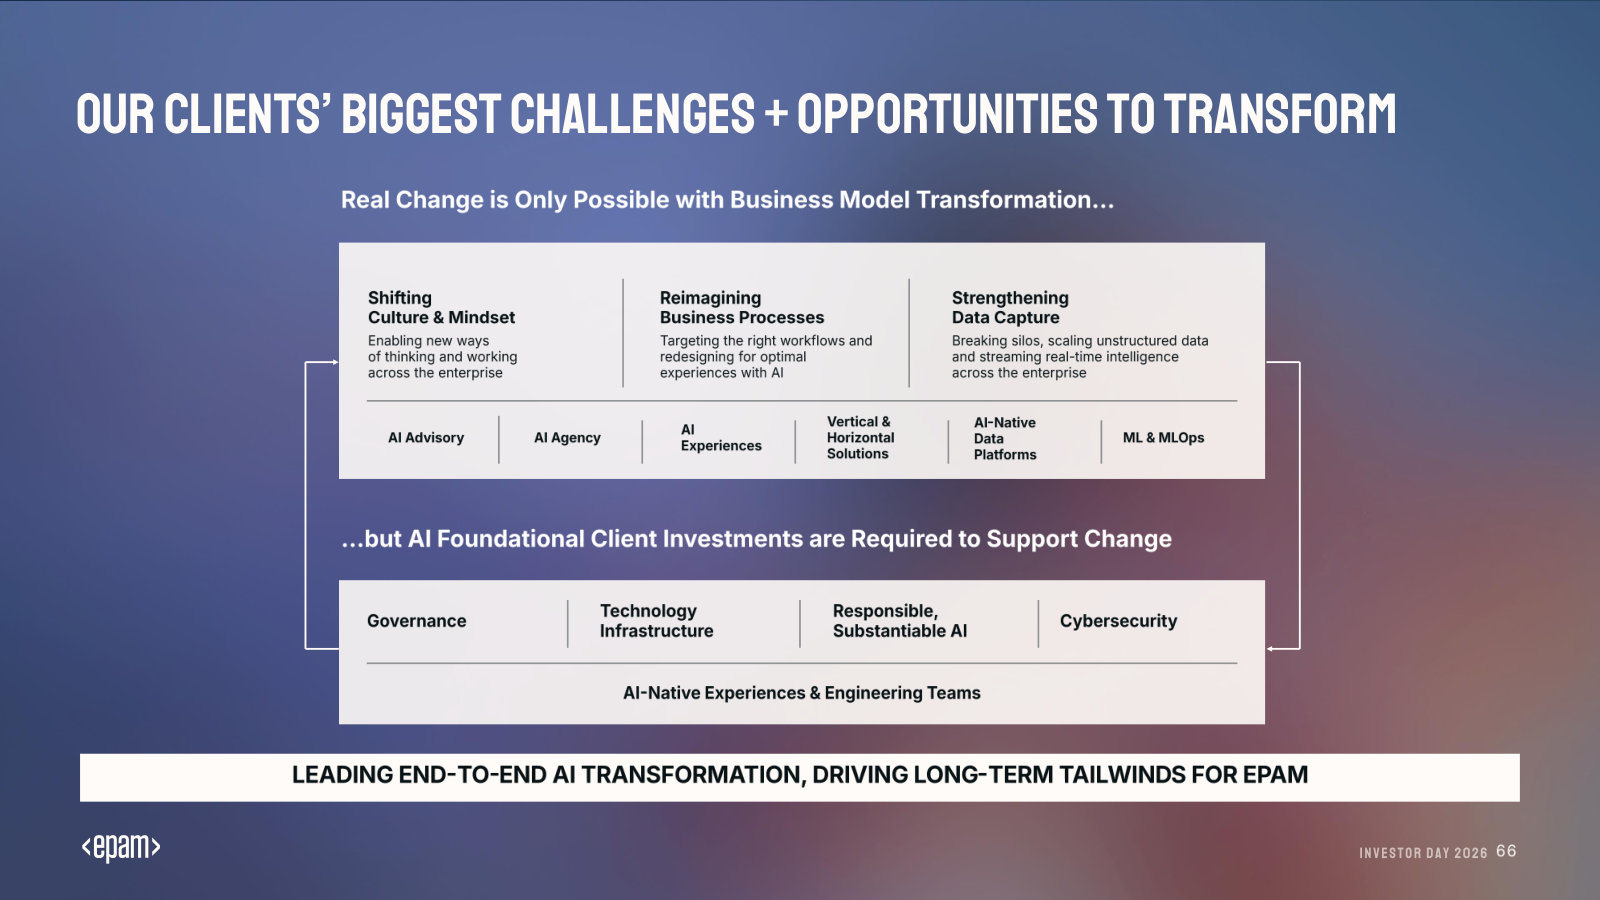
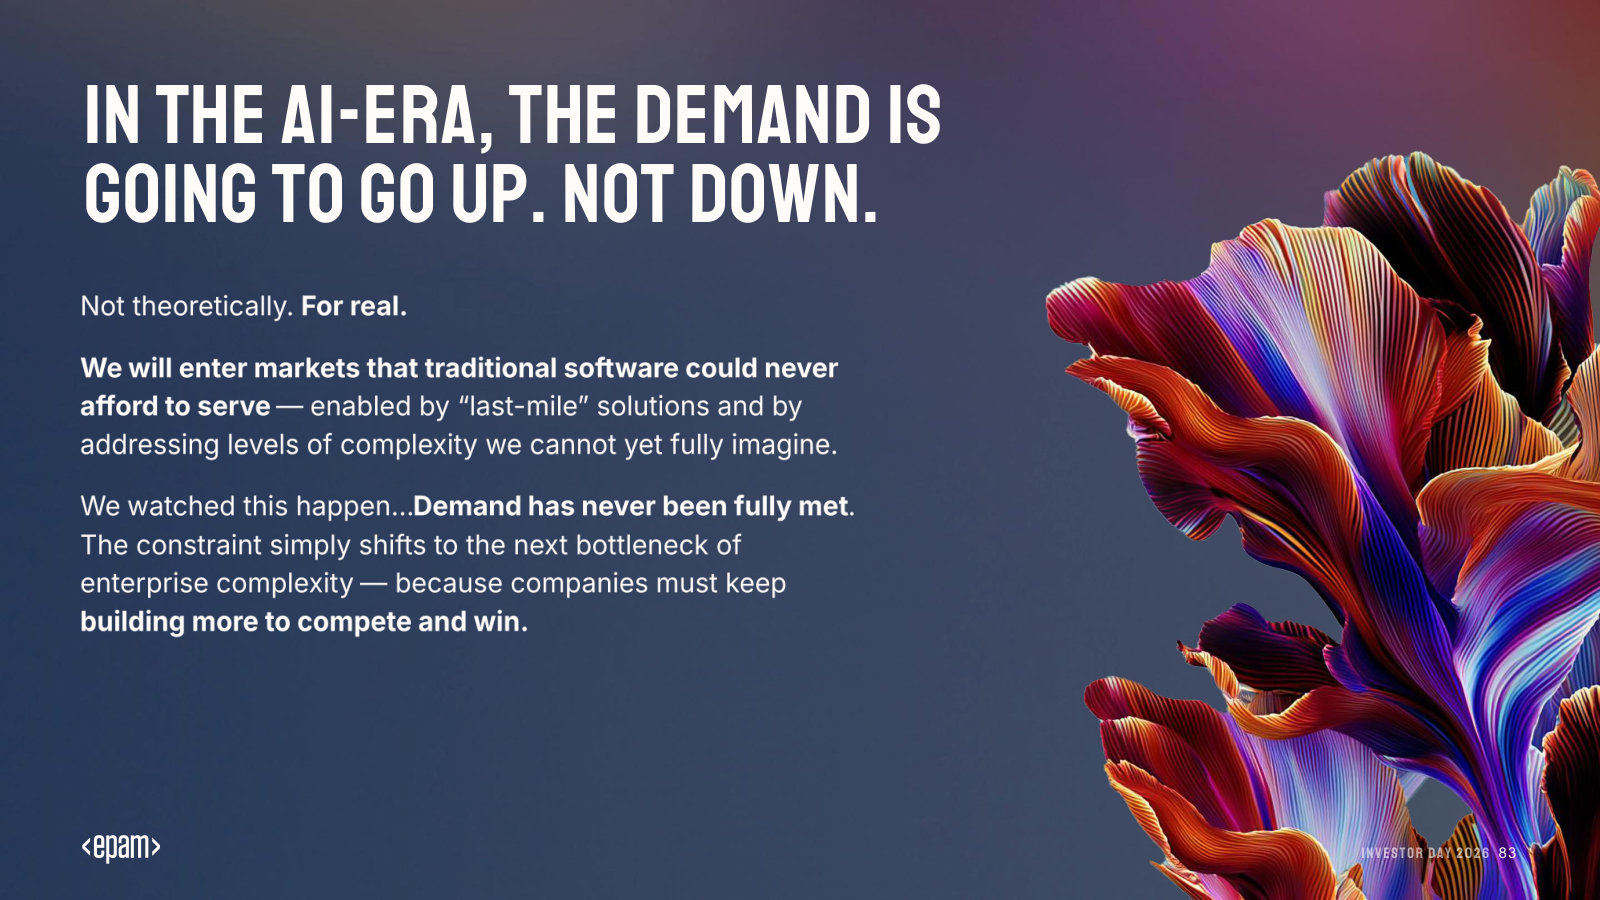
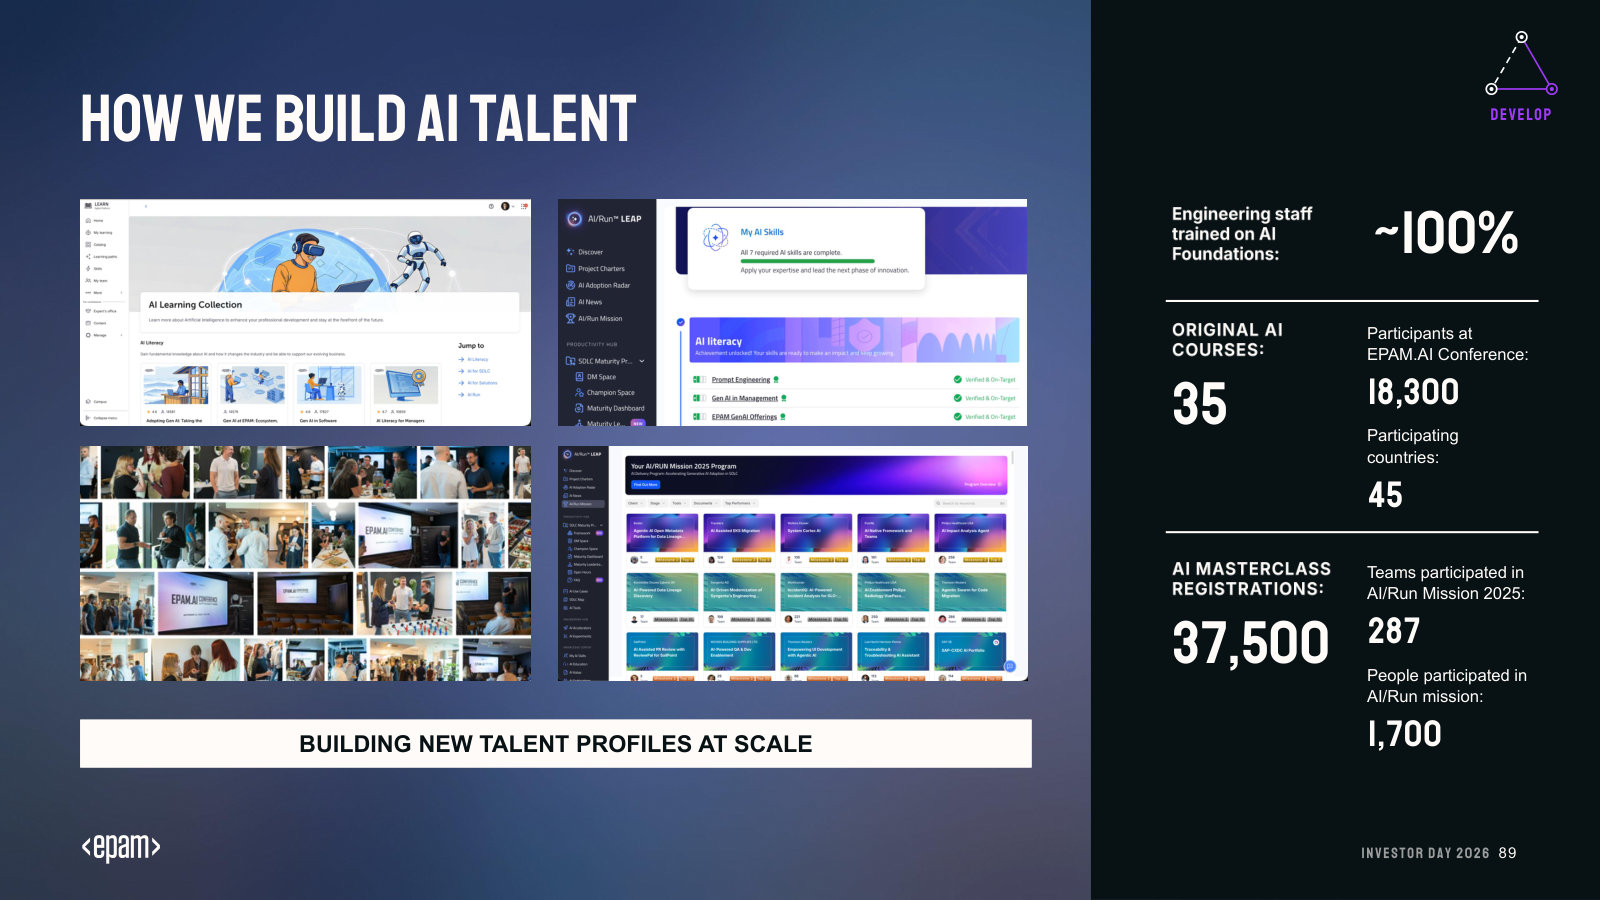
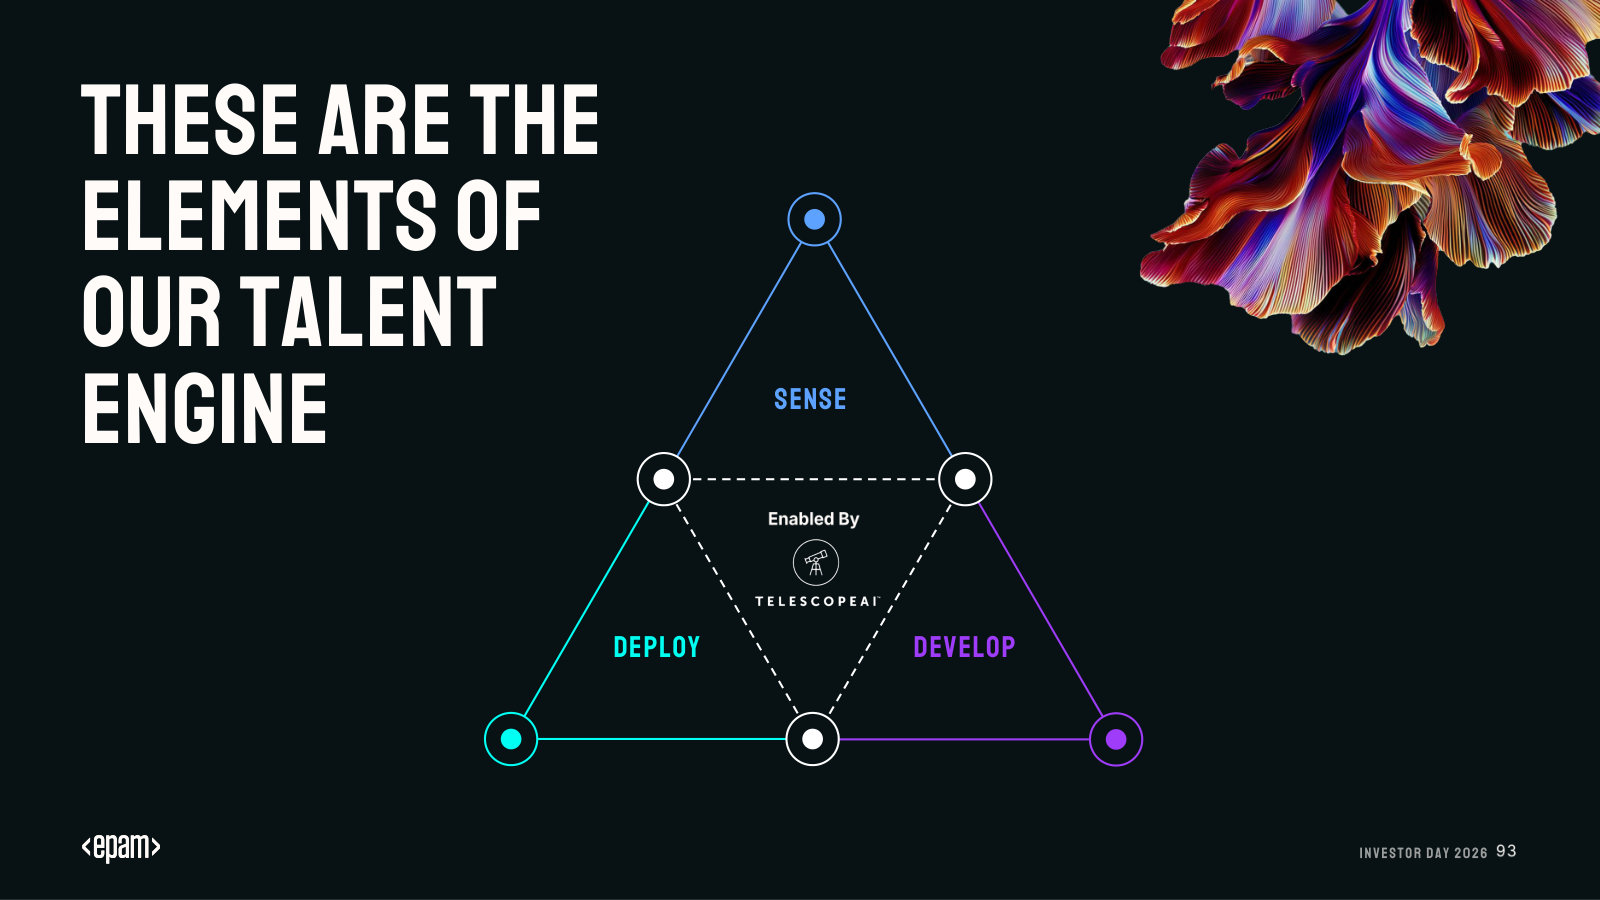
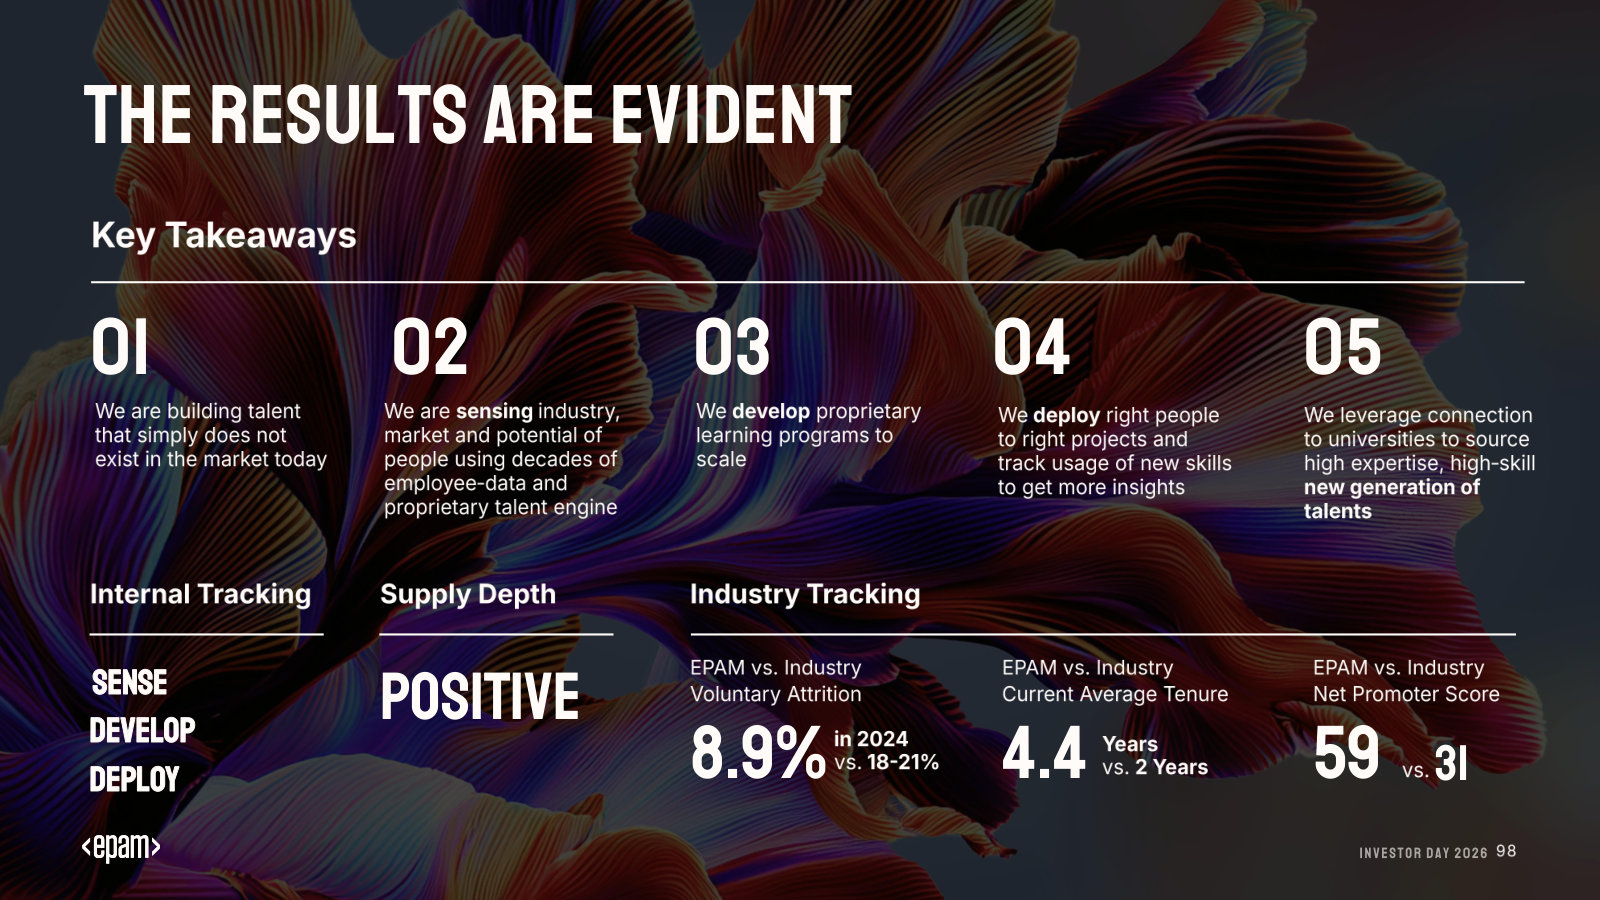
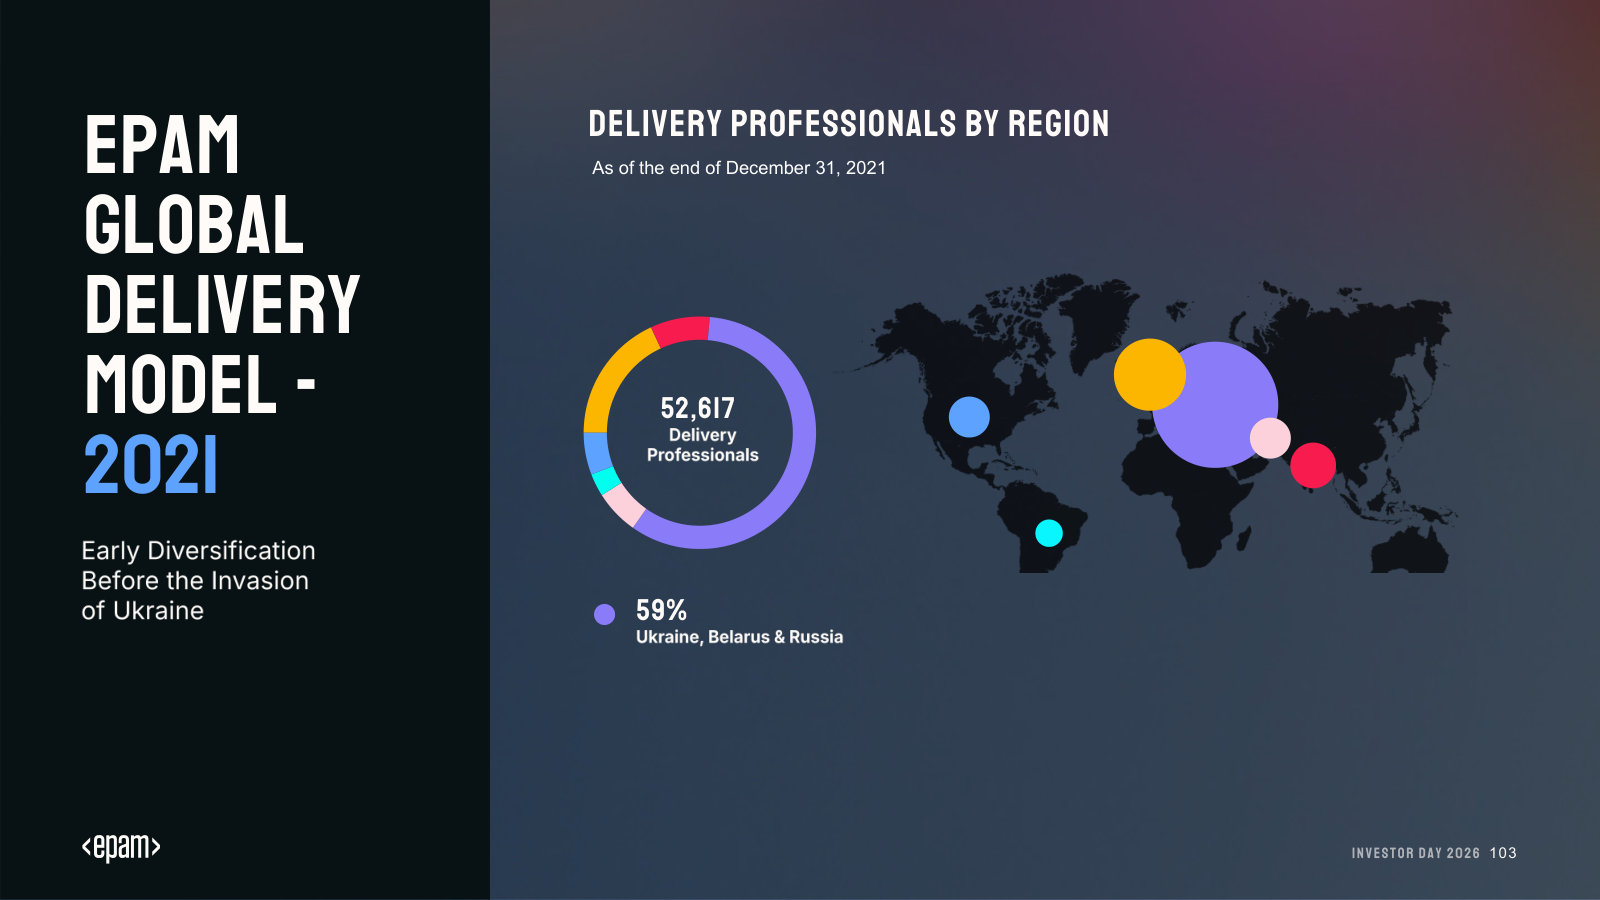
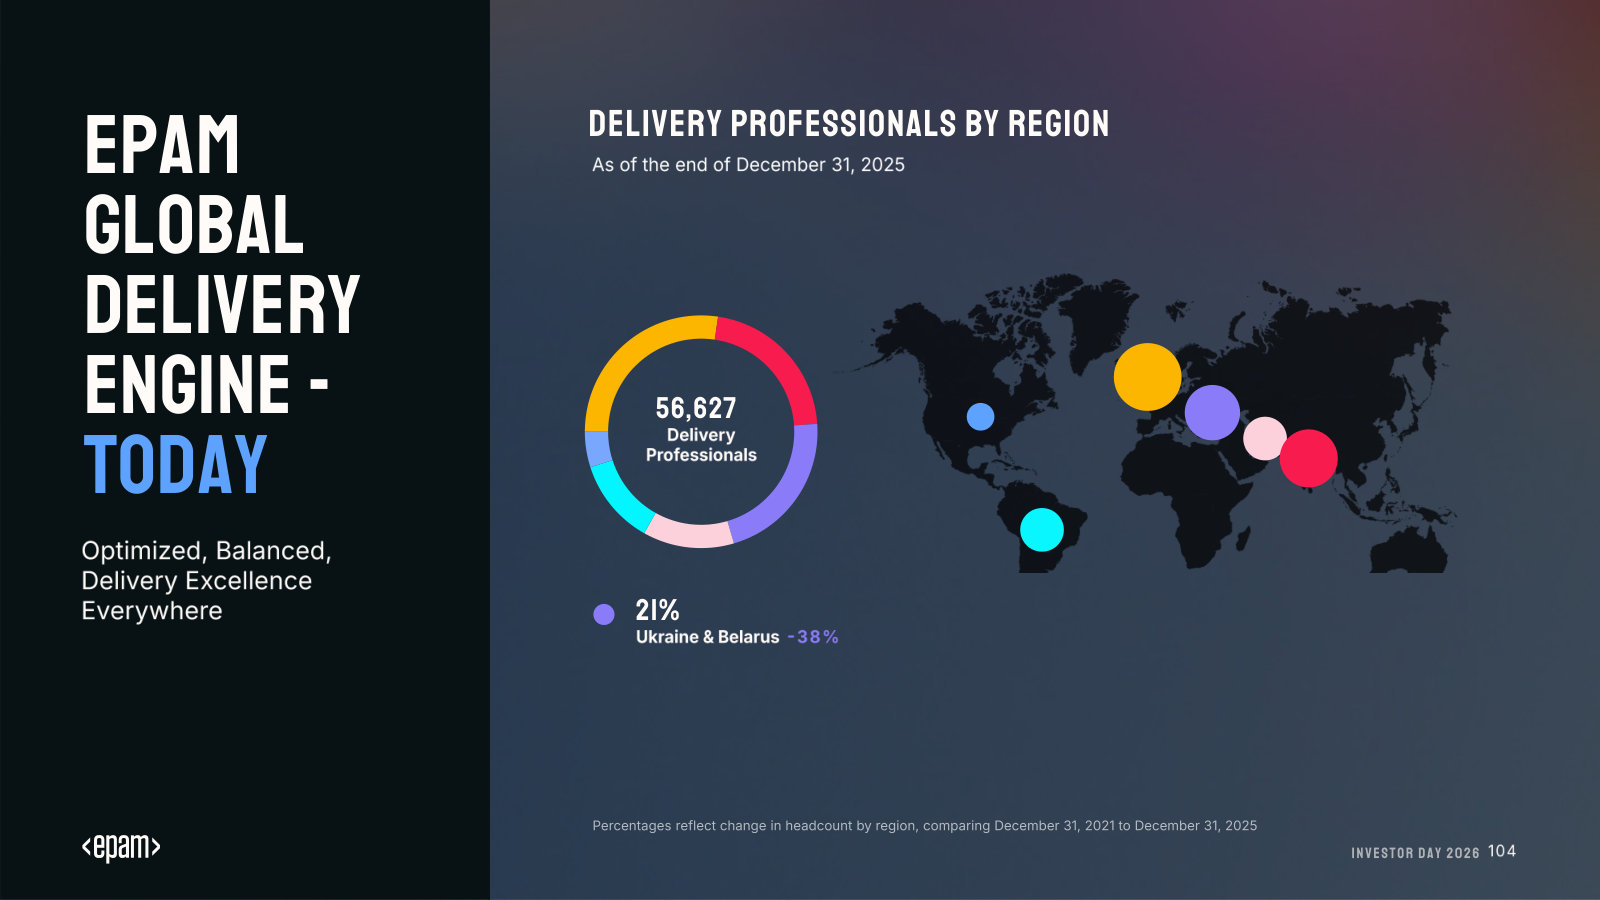
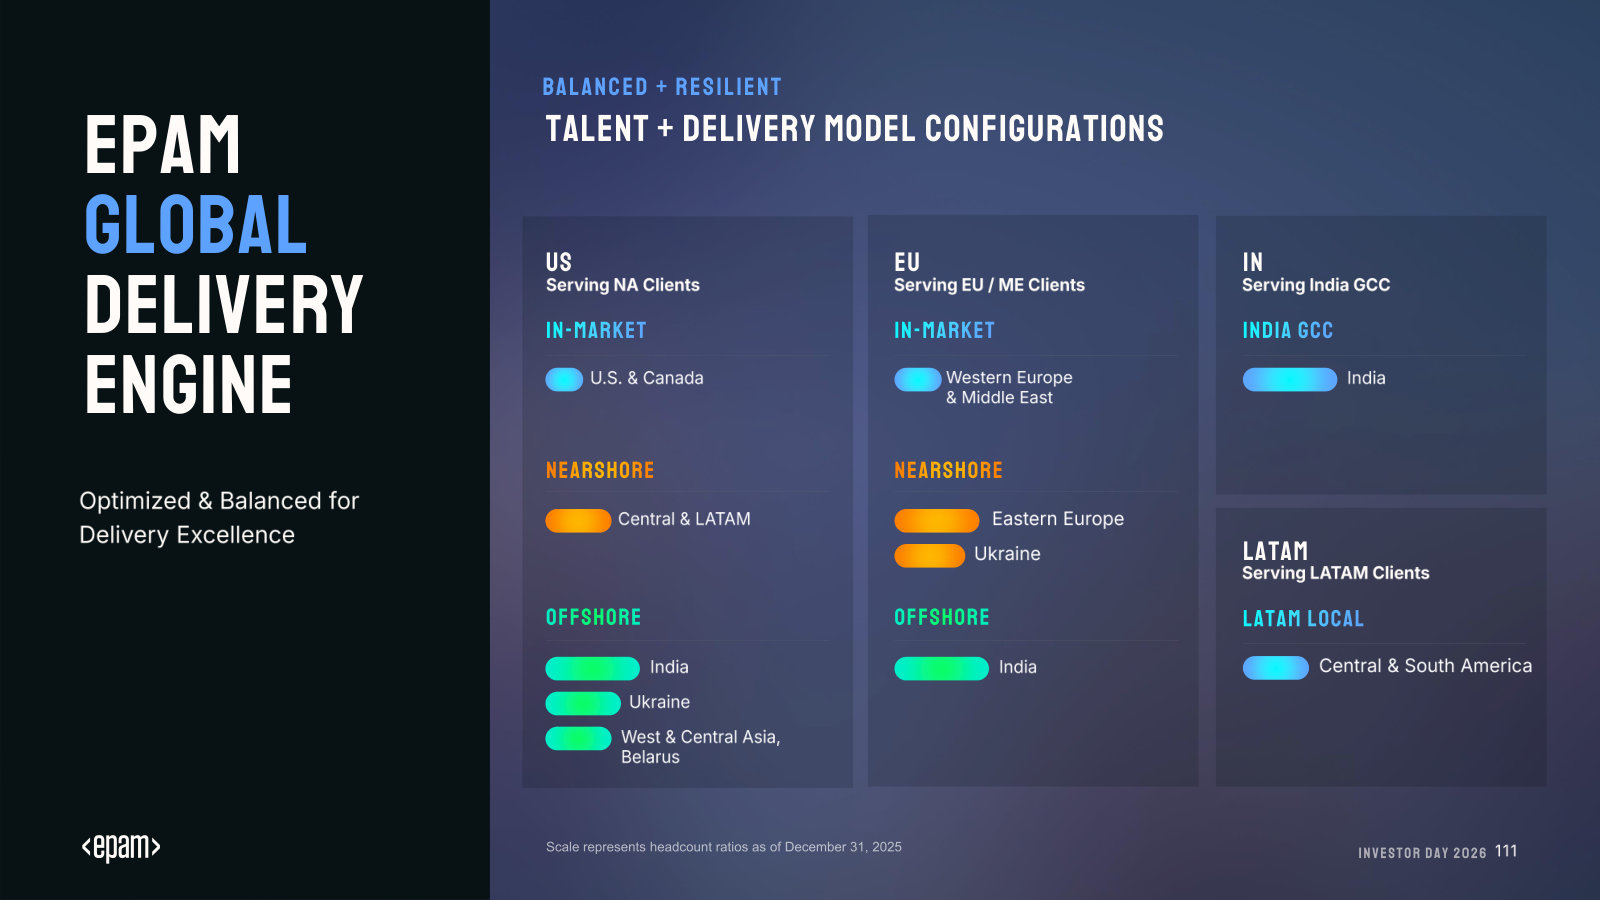
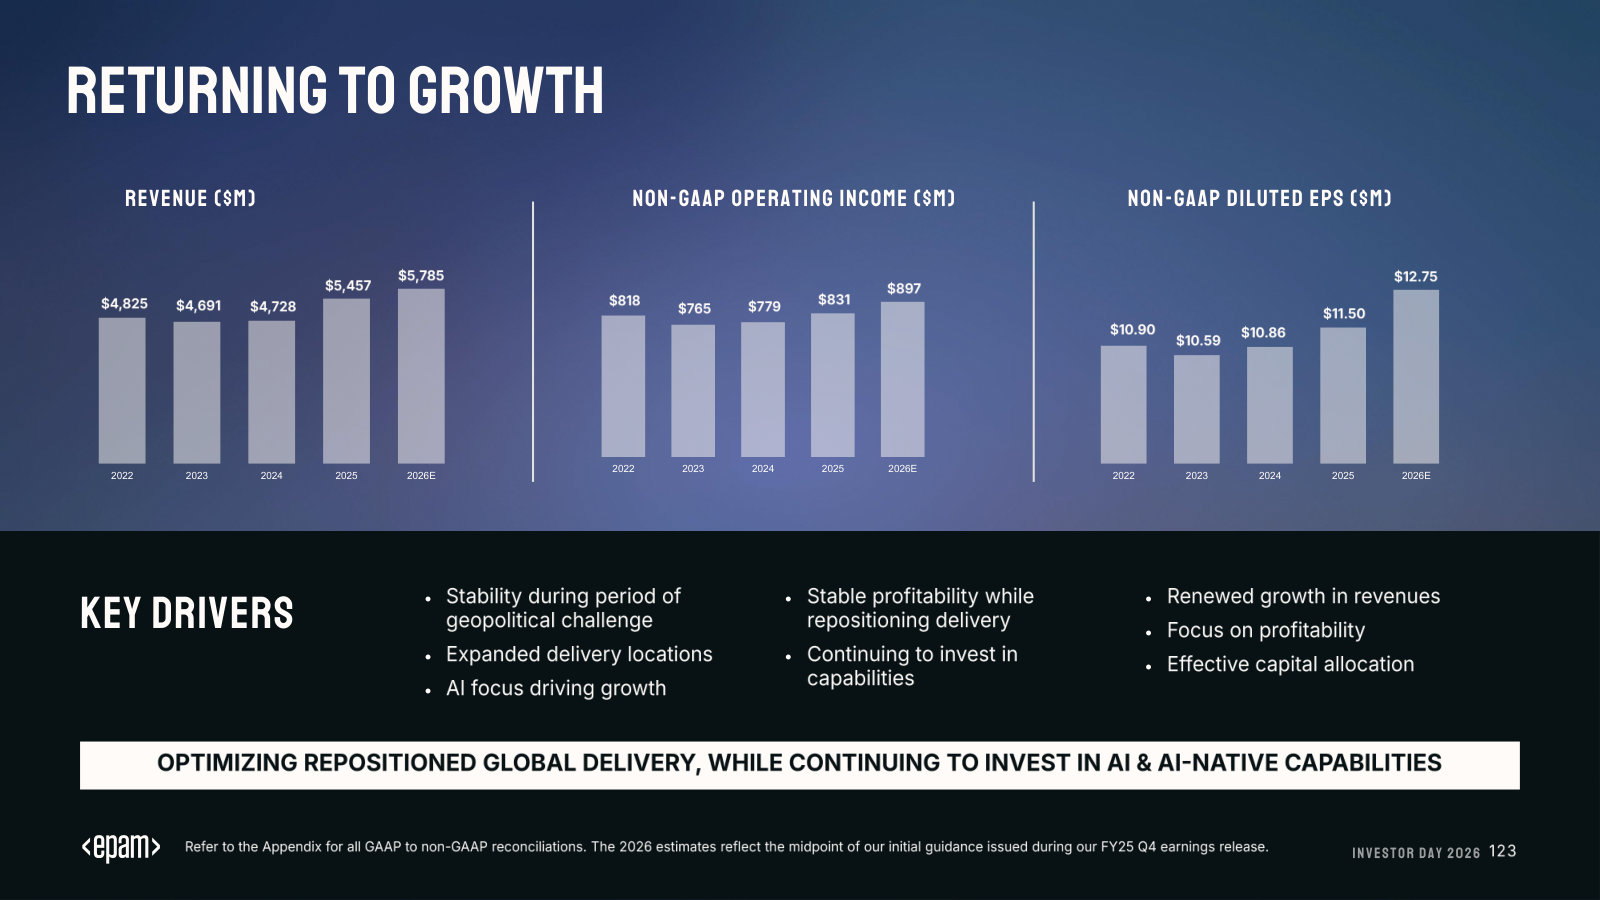
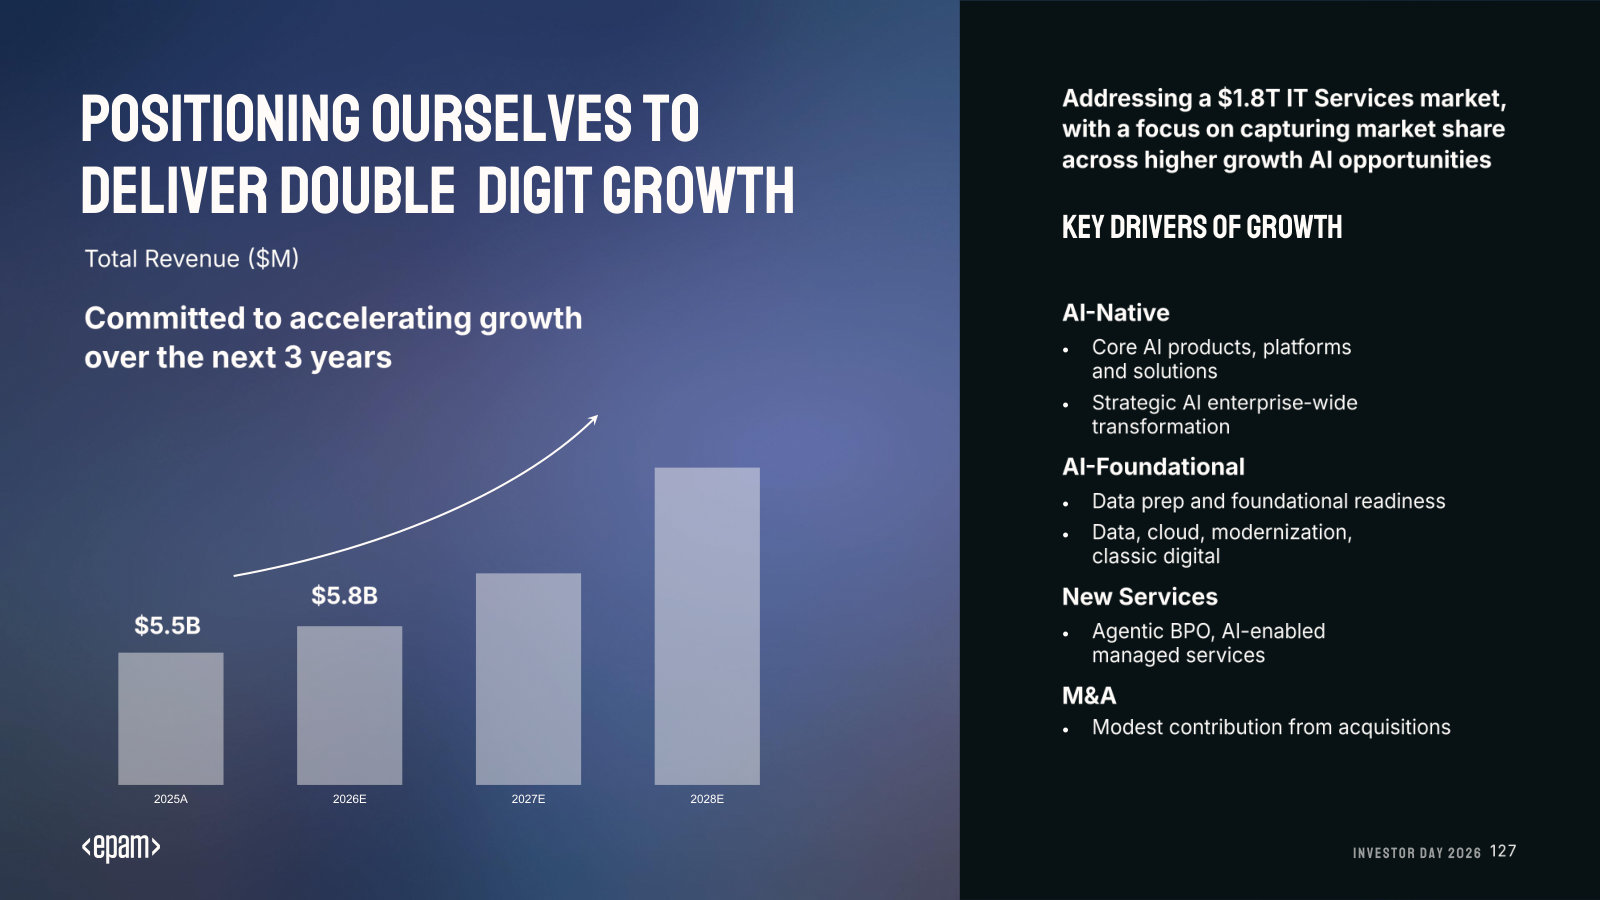
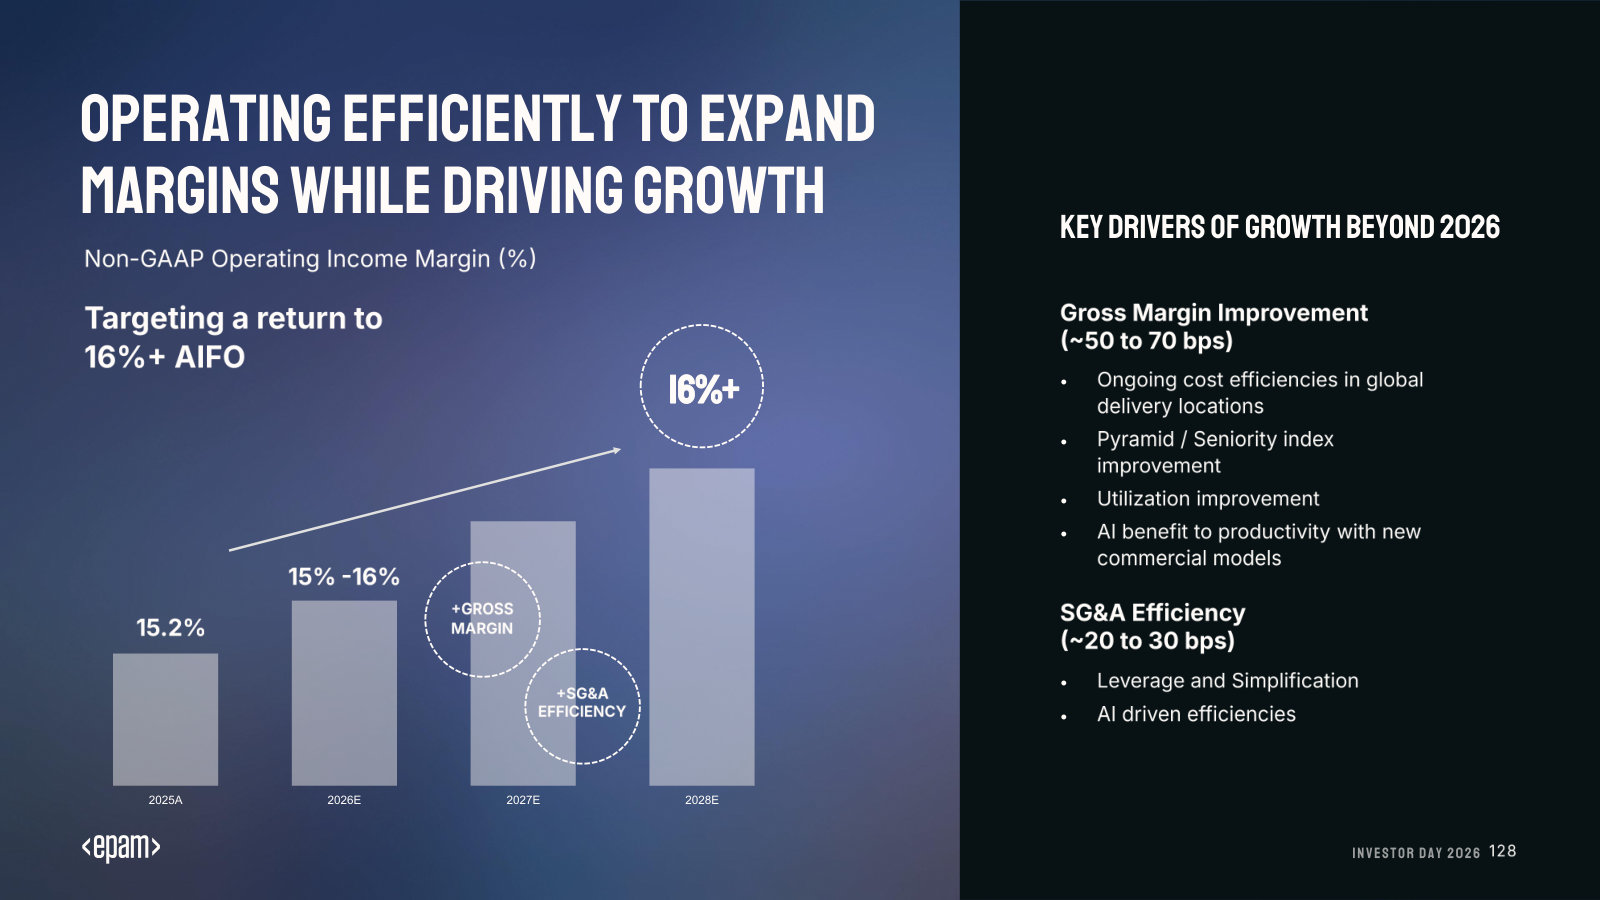
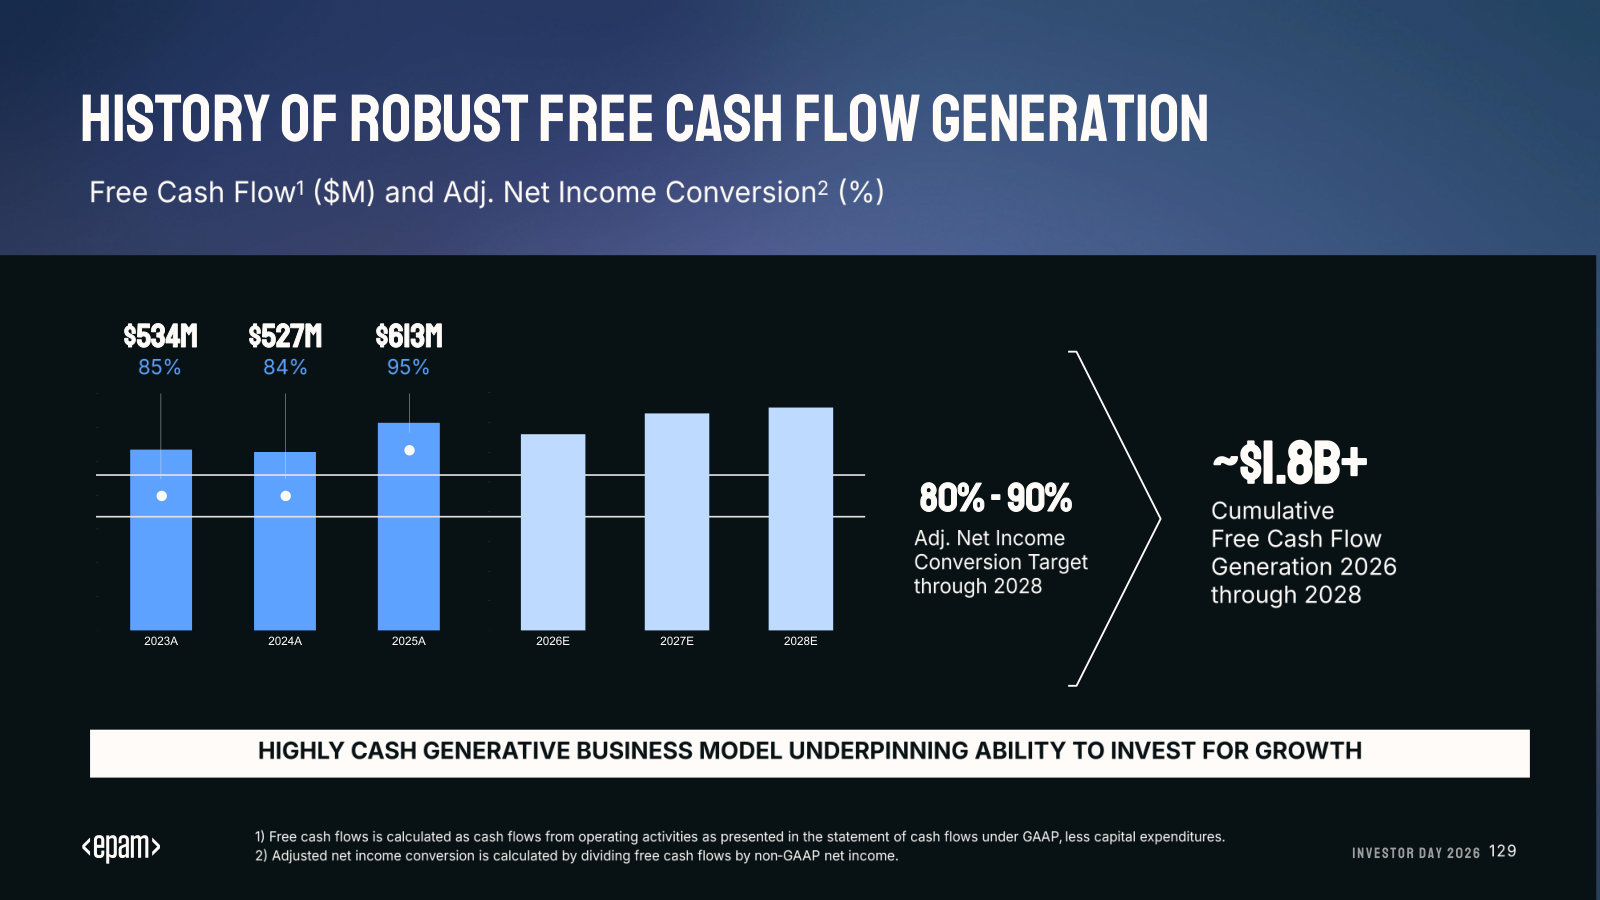
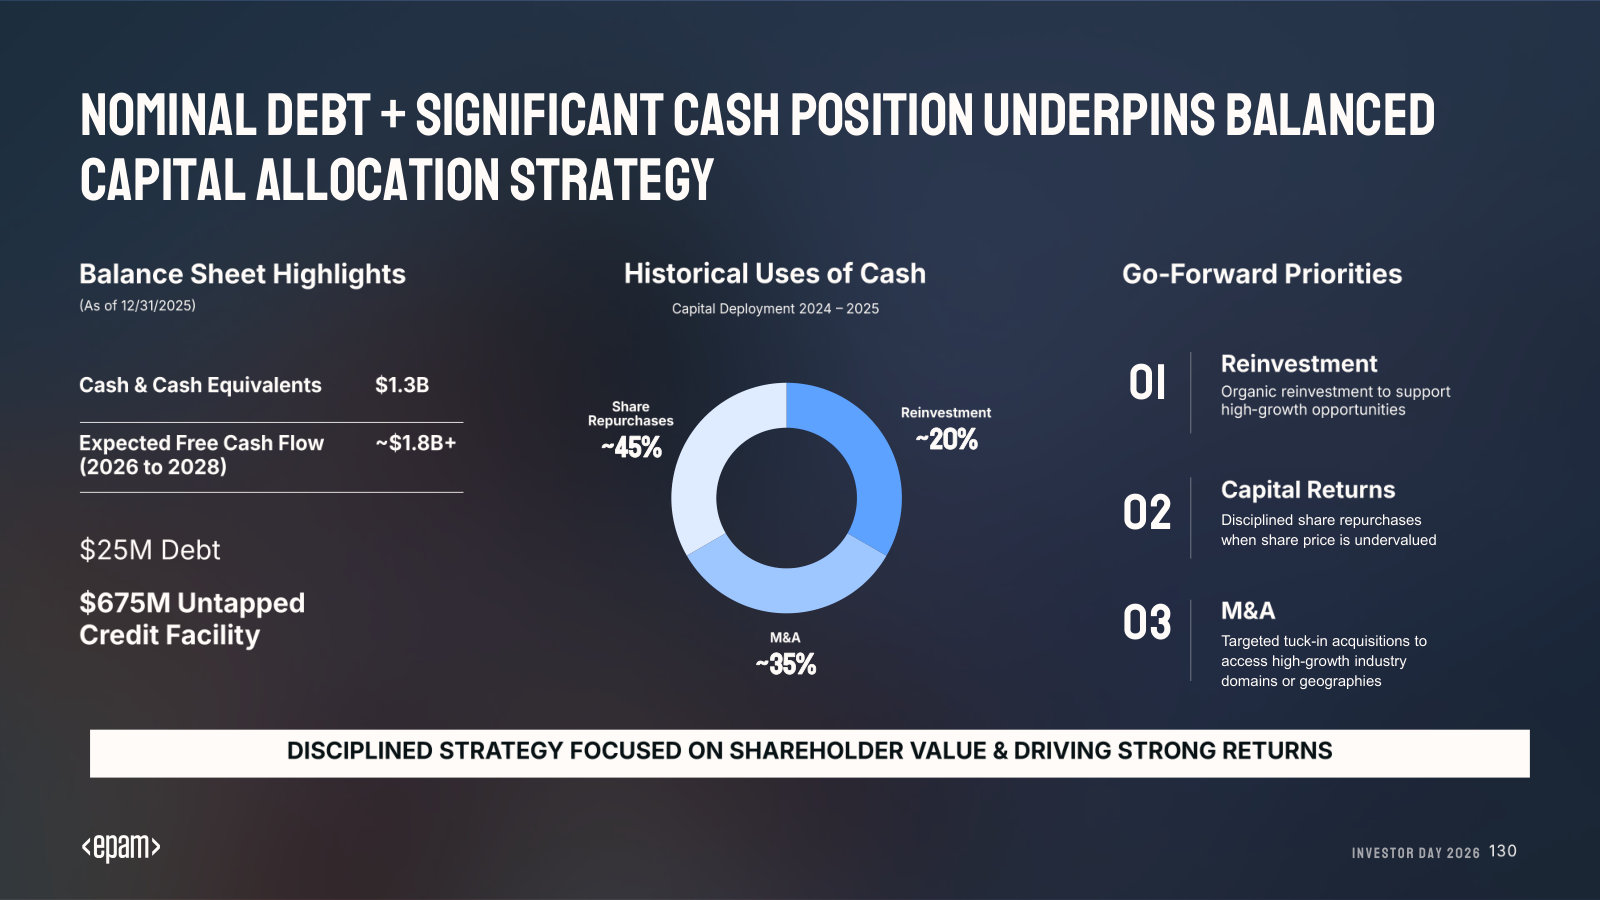
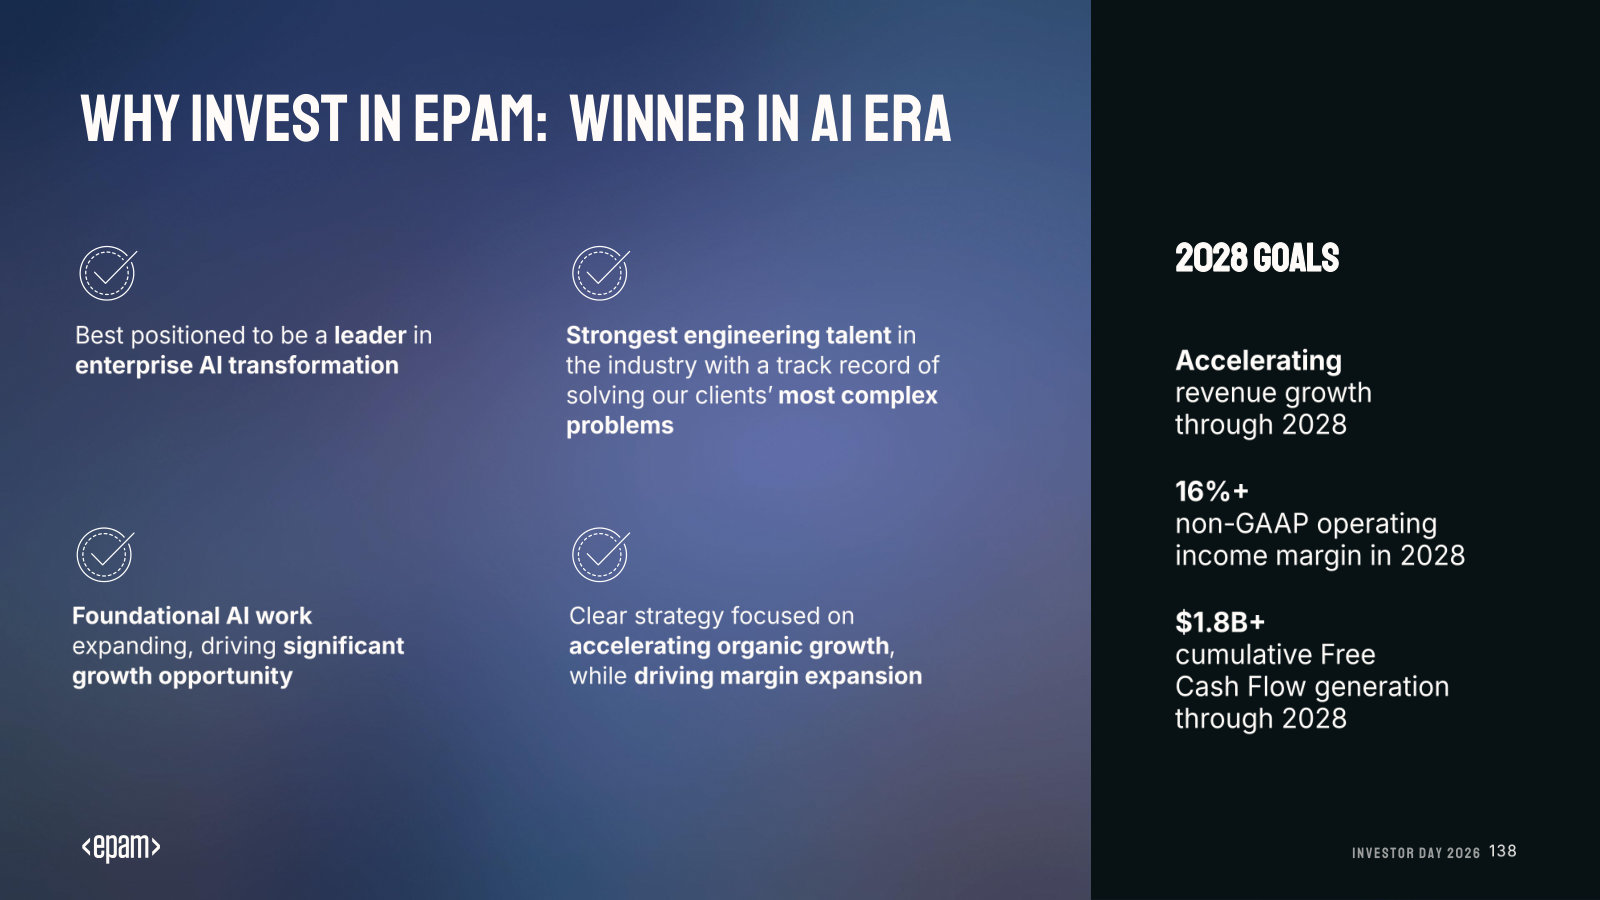
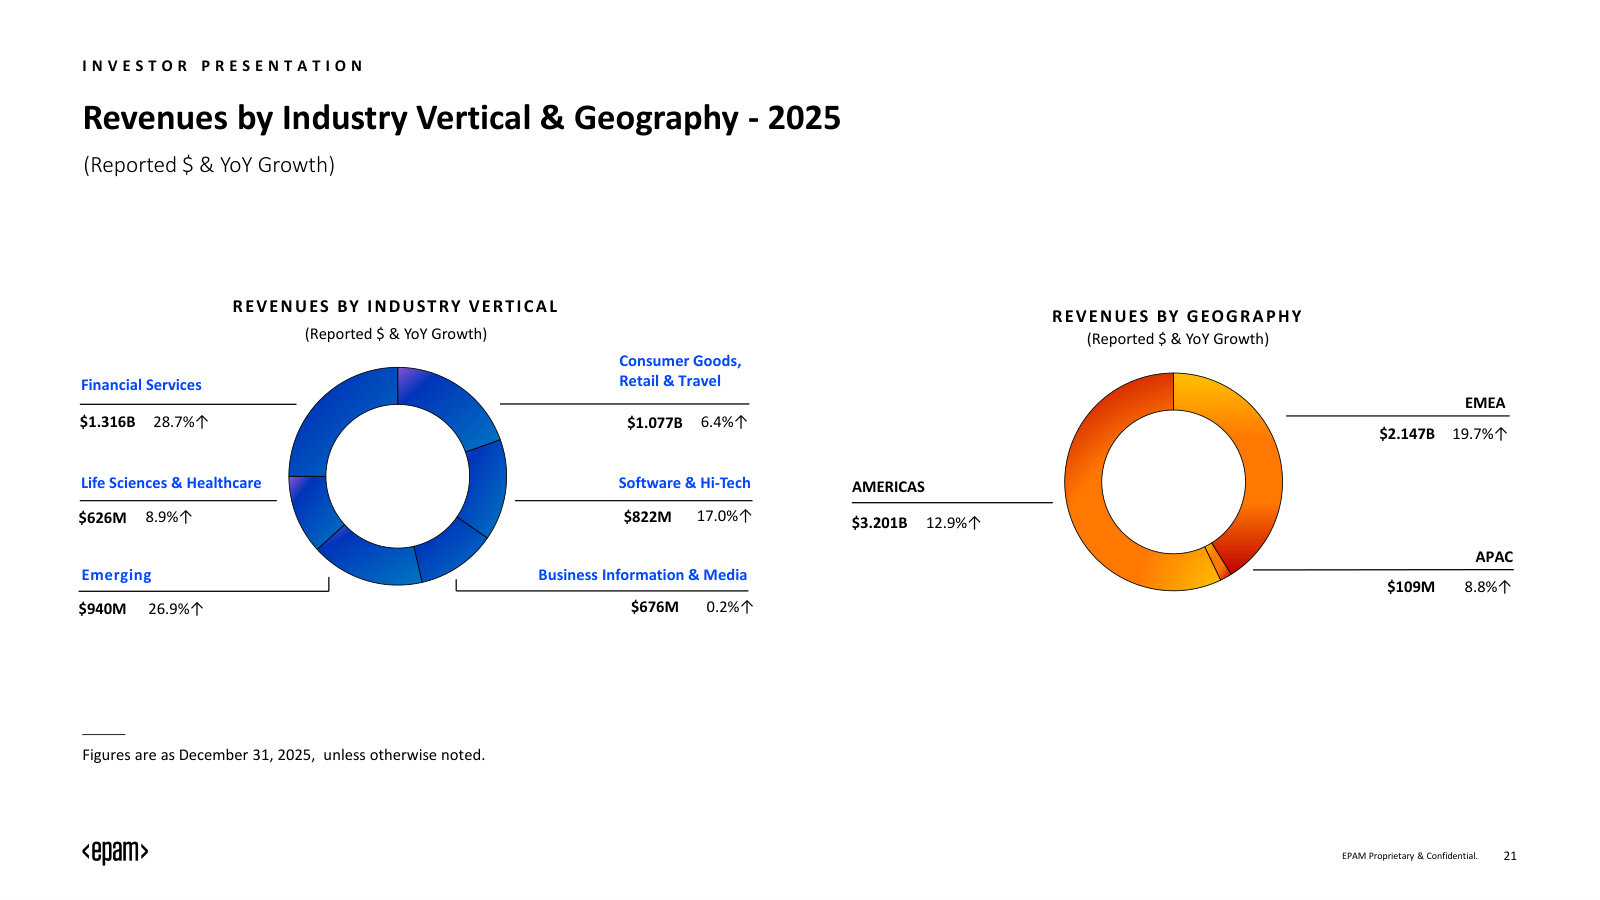
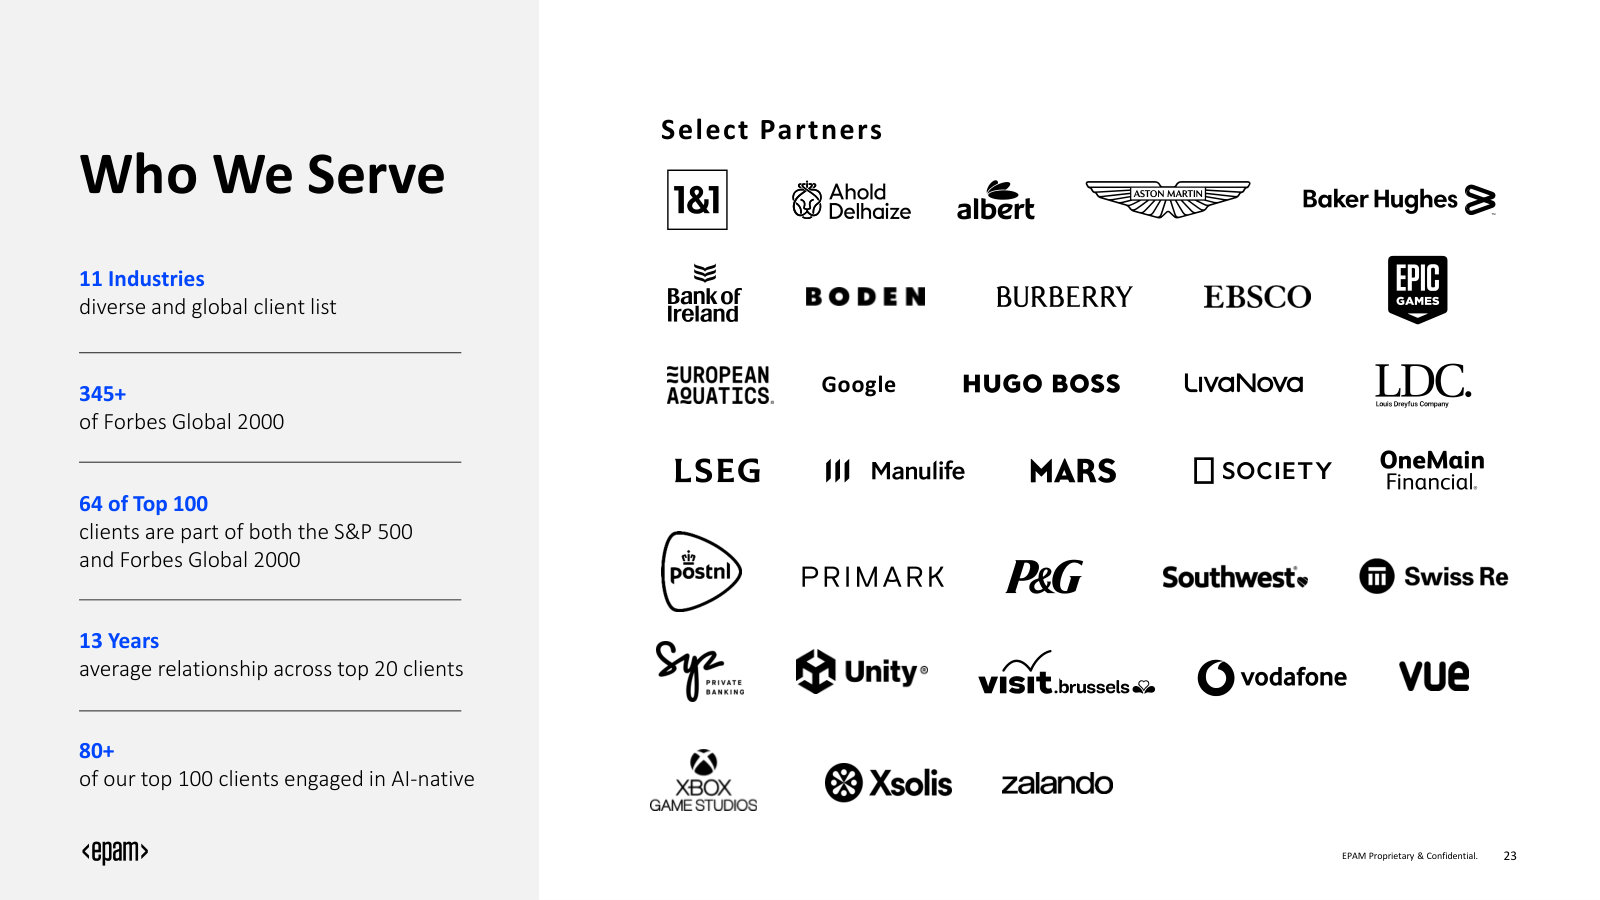
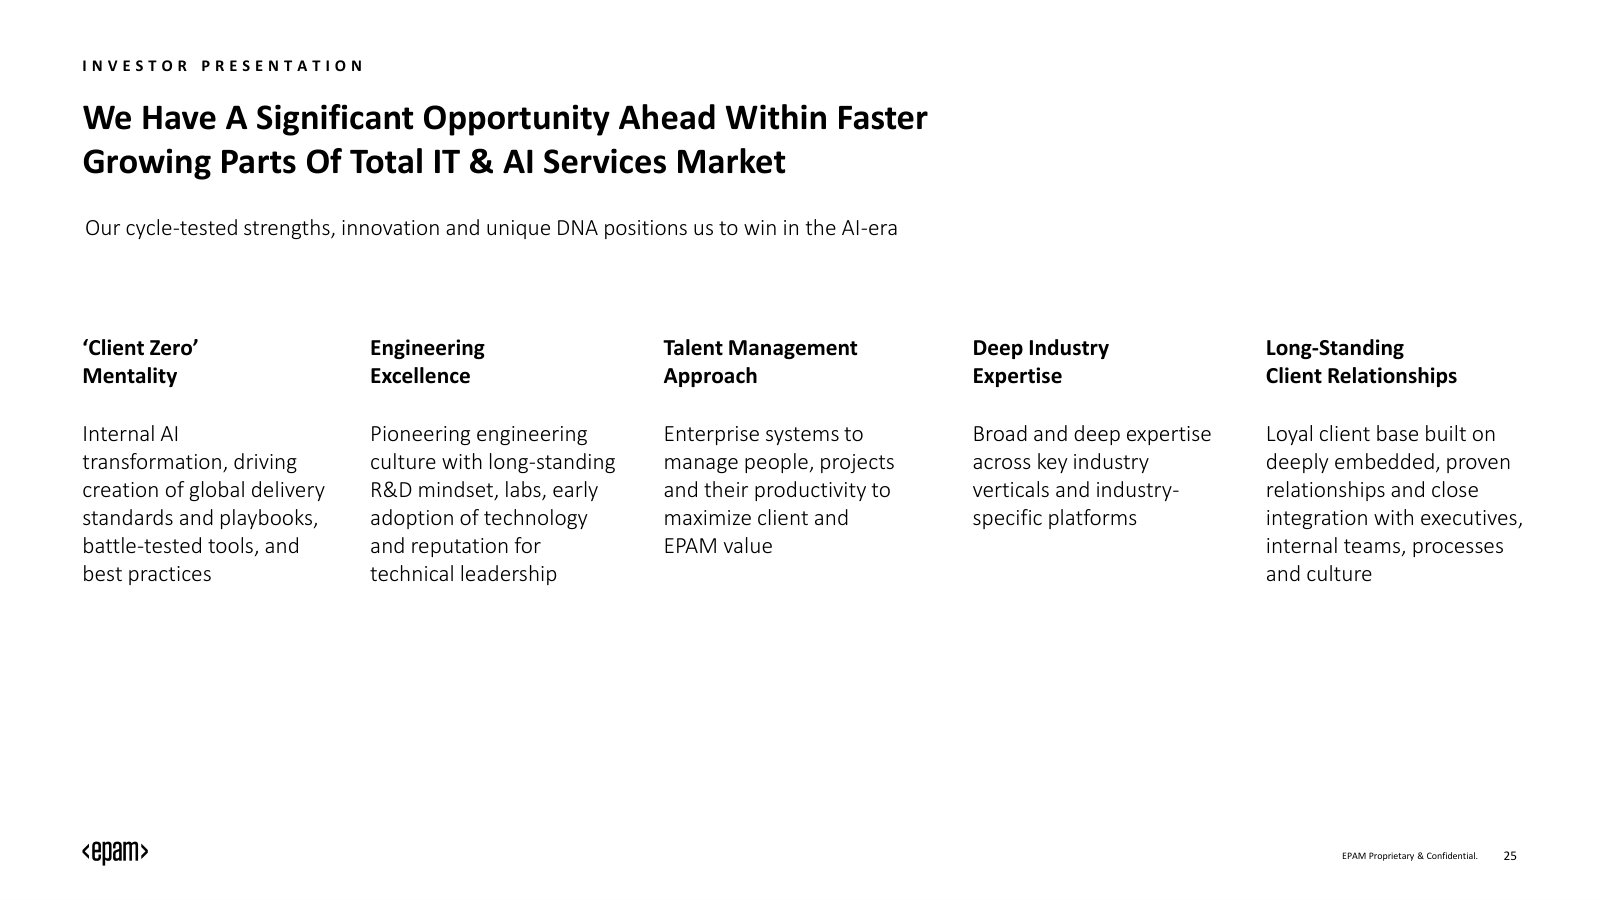
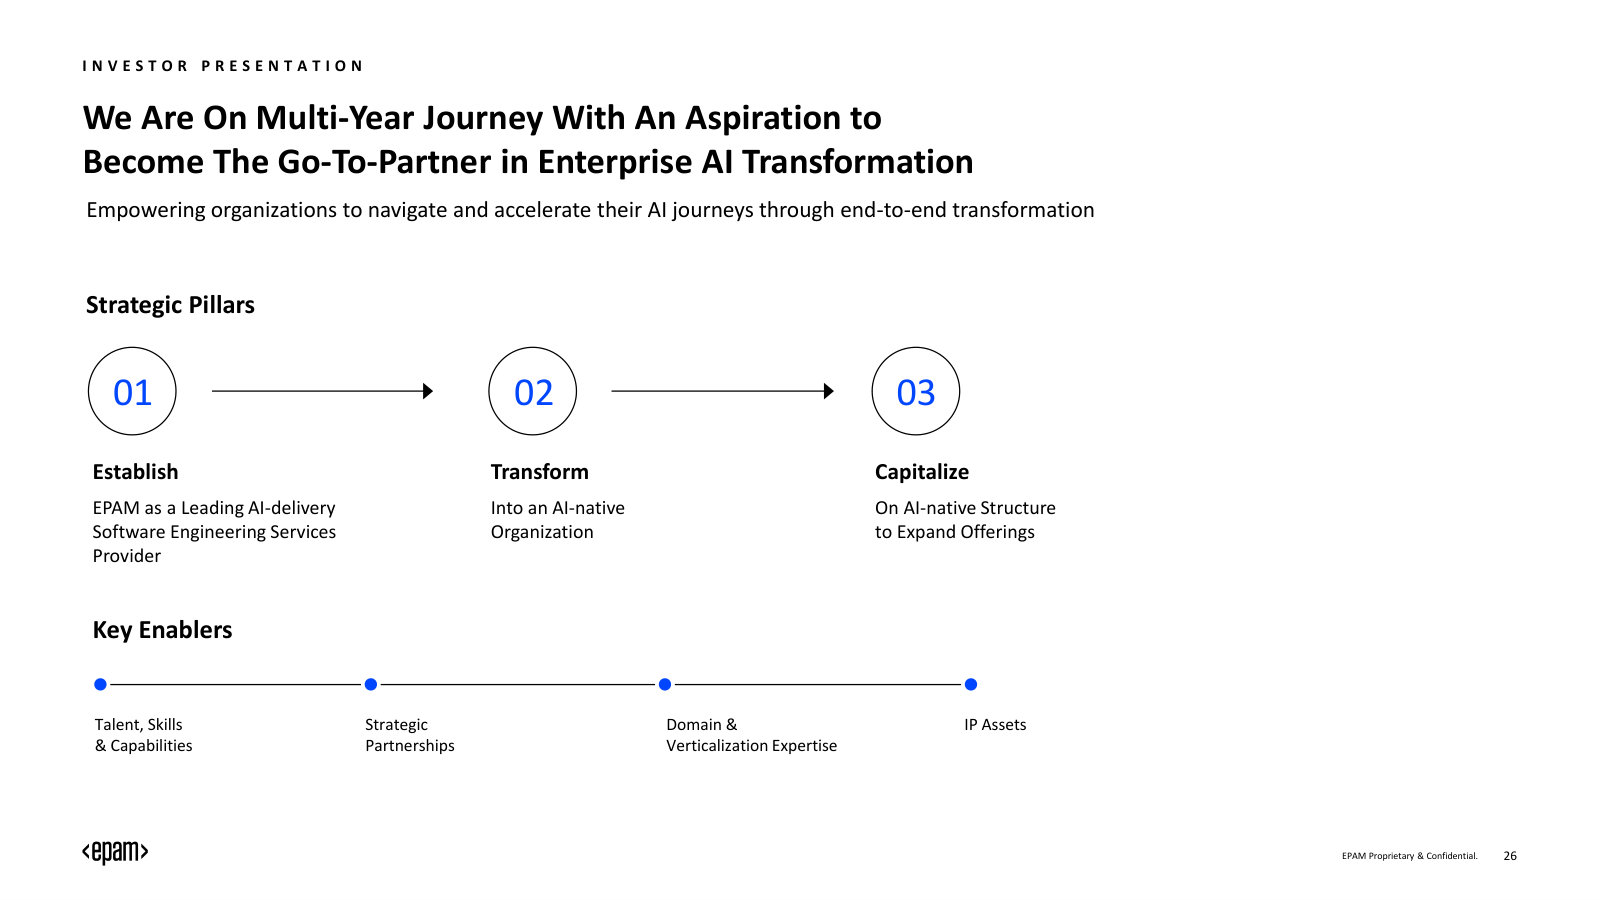
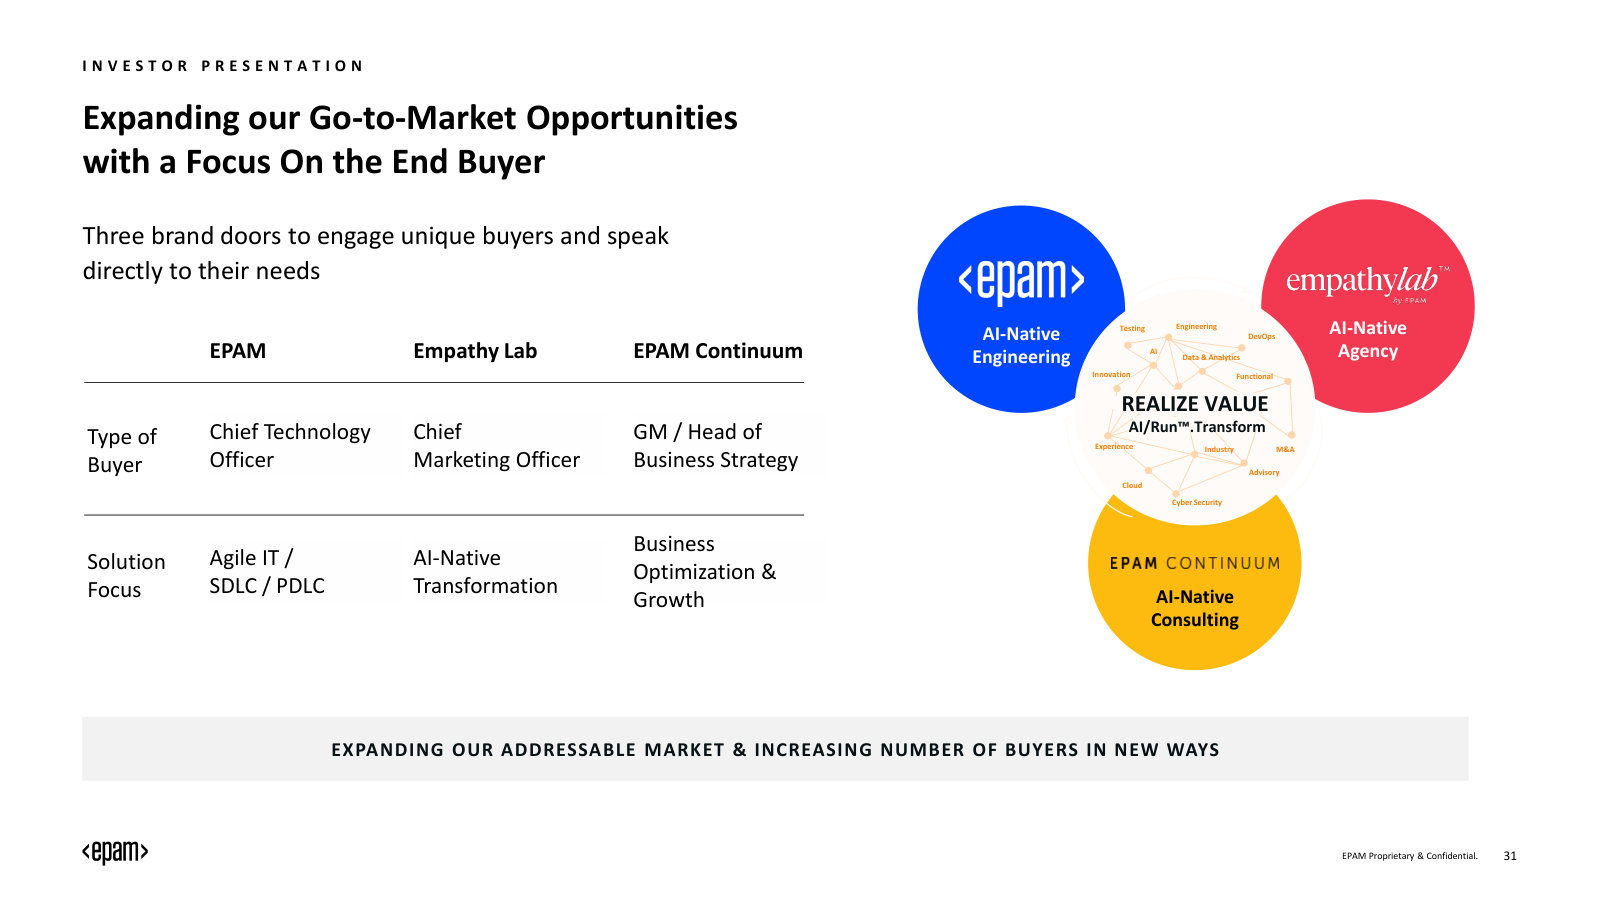
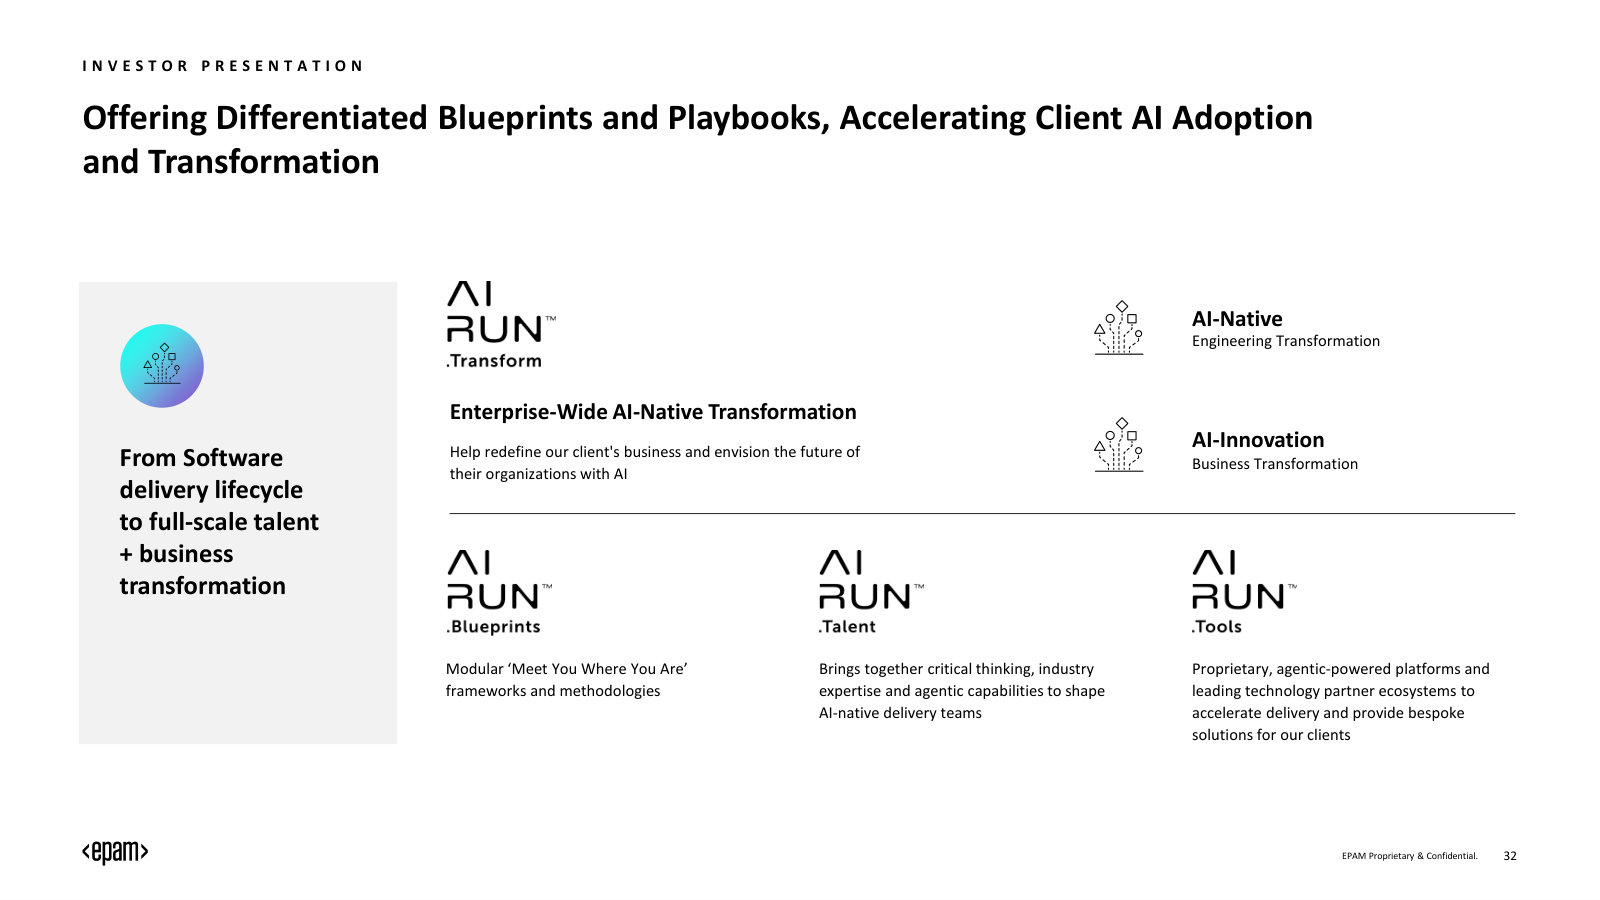
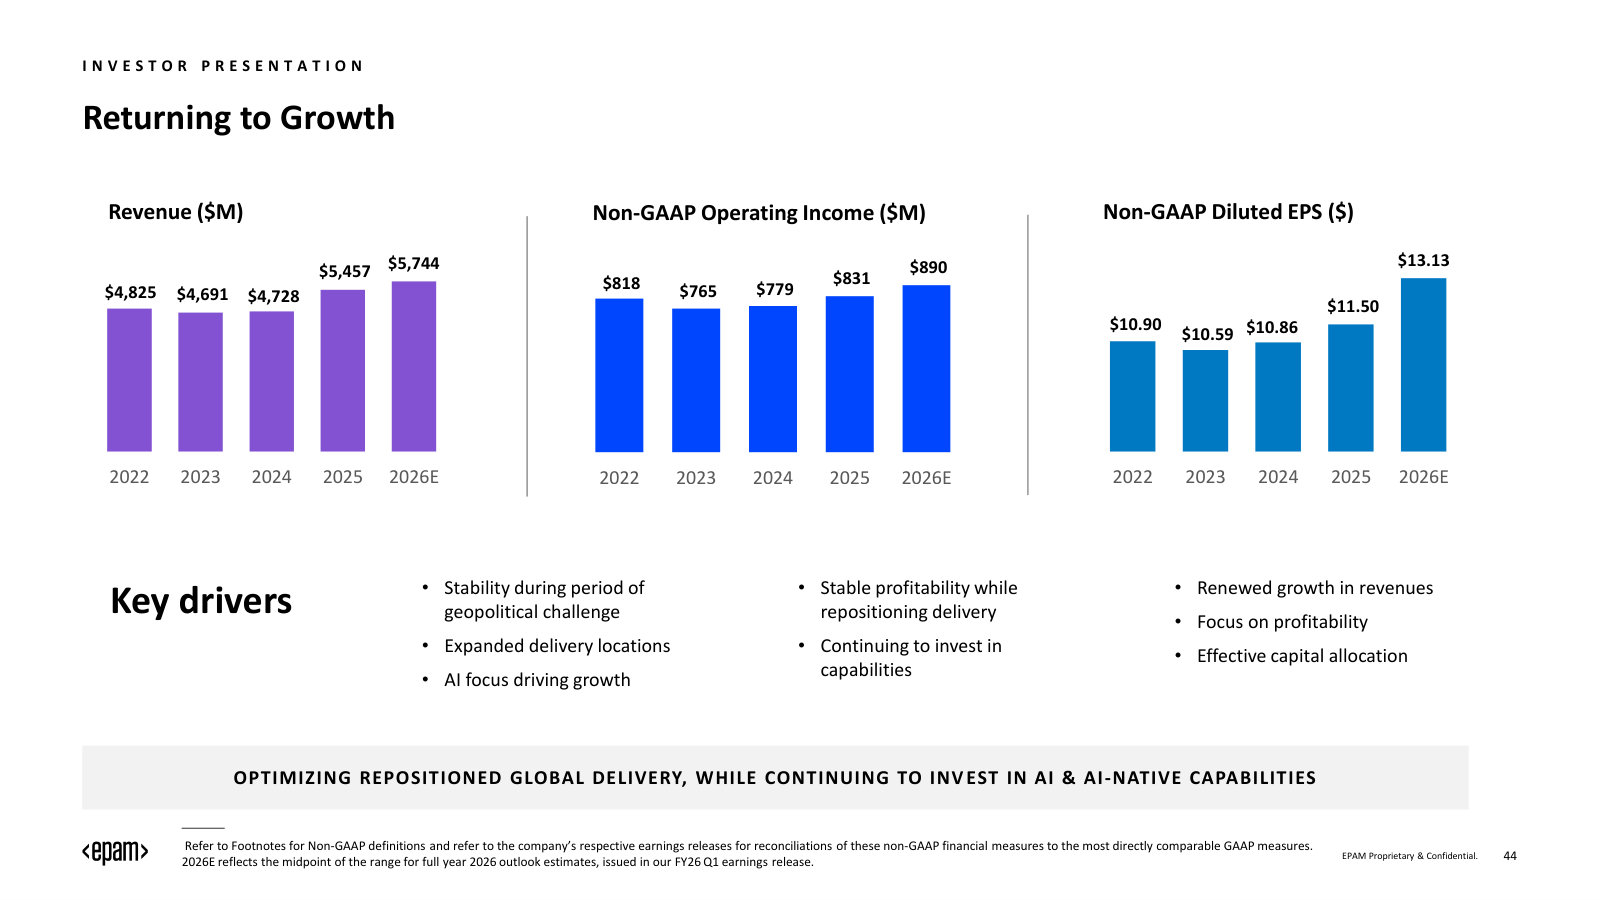
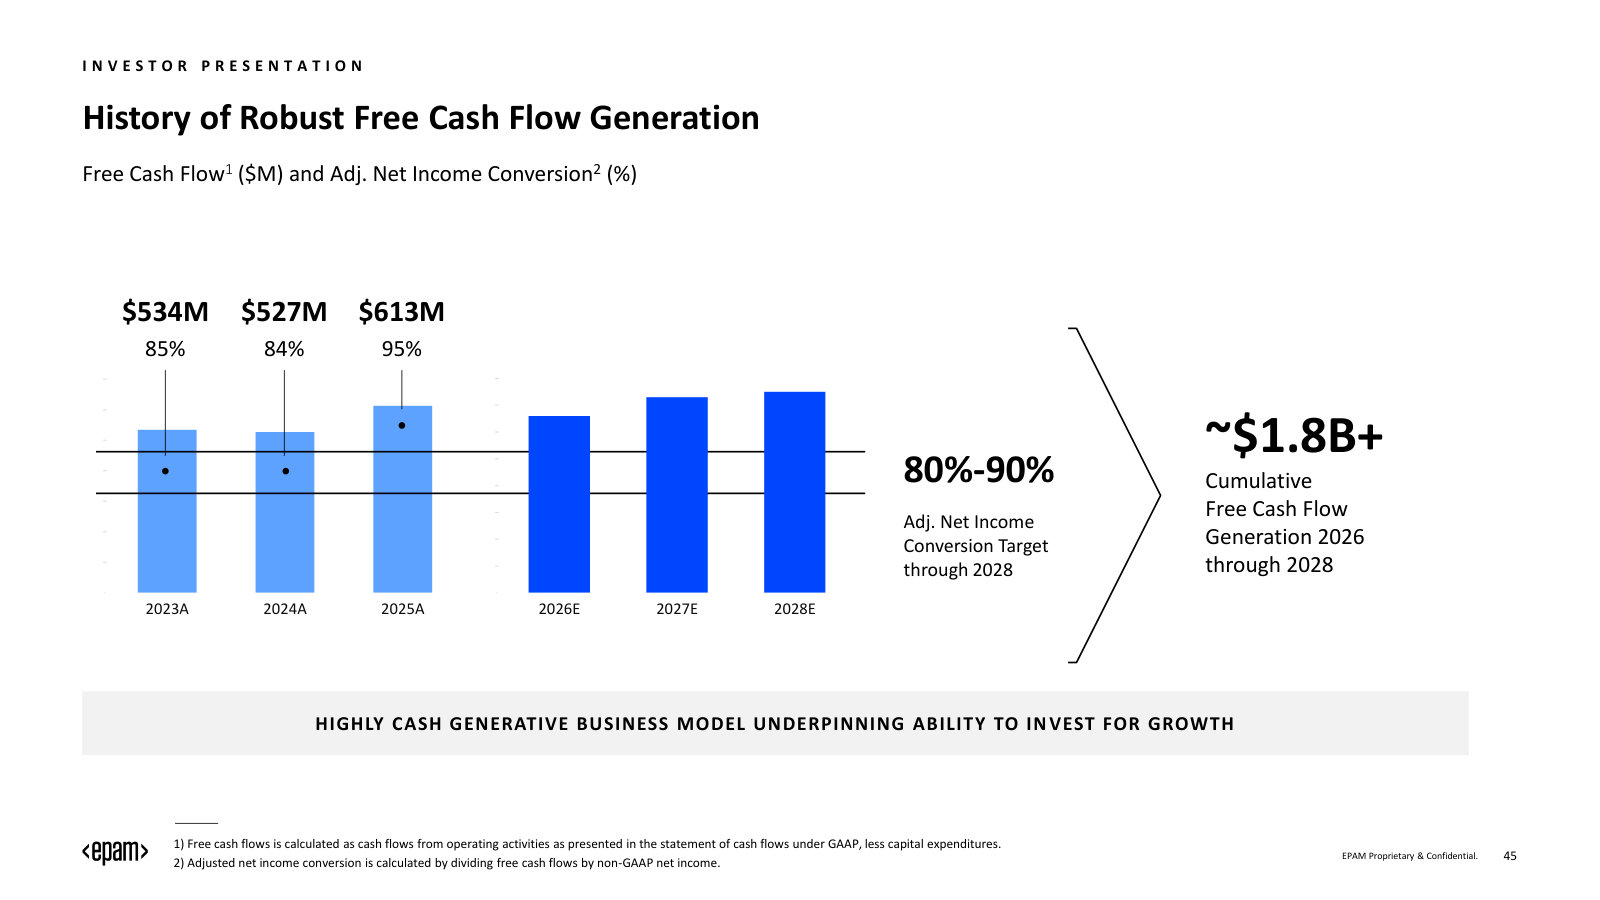
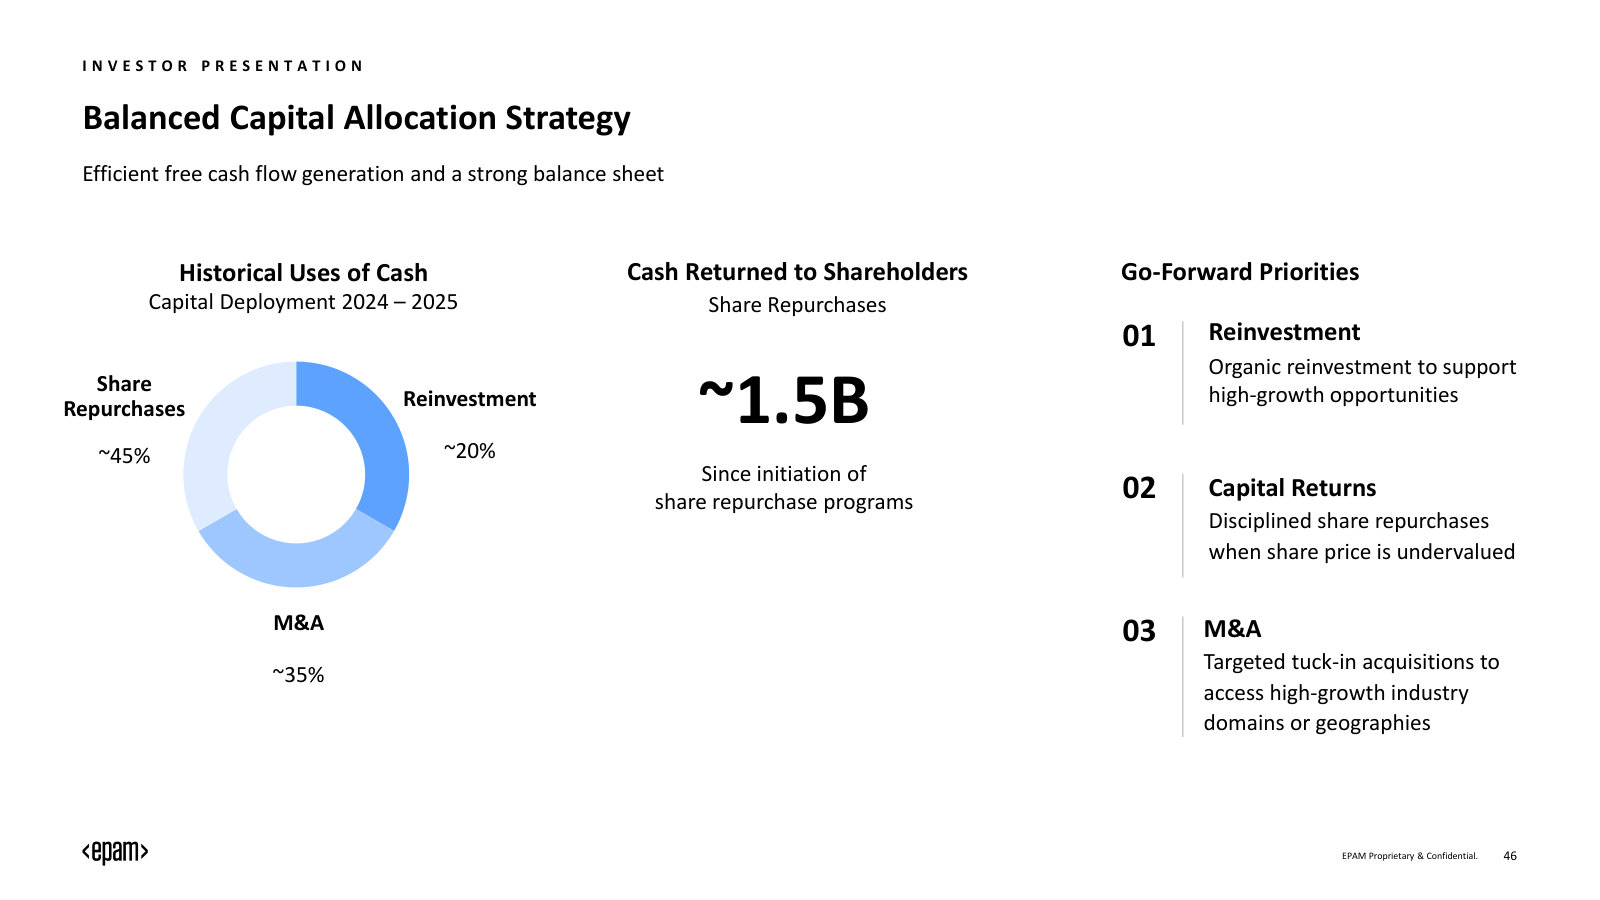
p. 12 — Where the $5.5B comes from — 2025 revenue split by industry vertical and by geography, with growth rates. · Open the full presentation →p. 14 — The client base — 11 industries, 345+ of the Forbes Global 2000, 13-year average tenure across the top 20 accounts. · Open the full presentation →p. 17 — The market EPAM plays in — a ~$1.8T IT services opportunity by 2029, mapped by segment growth (Gartner). · Open the full presentation →p. 18 — The AI-spending map — where the ~$4.7T AI market sits and the slice EPAM is targeting by 2029. · Open the full presentation →p. 20 — The stated goal — become the go-to partner in enterprise AI transformation — and the strategic pillars beneath it. · Open the full presentation →p. 21 — 'Client Zero' — how EPAM is rebuilding its own operations with AI before selling the same to clients. · Open the full presentation →p. 25 — The internal digital platform that runs delivery today — a unified dashboard with integrated agents. · Open the full presentation →p. 28 — The investment thesis in one slide — the reasons management argues EPAM wins in the AI era. · Open the full presentation →p. 33 — How the go-to-market is changing — shifting from geographies to capabilities, integrating consulting, accelerating with AI. · Open the full presentation →p. 35 — Three brands for three buyers — EPAM, Empathy Lab and EPAM Continuum, each aimed at a different decision-maker. · Open the full presentation →p. 37 — The old model vs the new — how the value proposition shifts from digital/cloud to full AI-native transformation. · Open the full presentation →p. 44 — Why AI makes enterprises more complex, not less — the eight simultaneous dimensions clients must operate across. · Open the full presentation →p. 45 — When agents write the code, a new discipline appears — specification, architecture and verification become the work. · Open the full presentation →p. 46 — 'Delivery-as-code' — the AI-native delivery pipeline and the full-stack agentic engineer built to run it. · Open the full presentation →p. 47 — The core argument — engineering depth is the moat, and AI widens it rather than erasing it. · Open the full presentation →p. 51 — AI/Run.Tools in practice — flexibility across stacks, with concrete productivity and cost gains from real engagements. · Open the full presentation →p. 53 — The demand case — an infinite backlog of complex engineering as AI opens markets software could never serve. · Open the full presentation →p. 63 — Beyond services — examples of new AI-native businesses EPAM helps clients stand up, with real cases. · Open the full presentation →p. 64 — AI/Run.Transform — the repeatable playbook that turns AI strategy into delivered business outcomes. · Open the full presentation →p. 66 — Where the real value sits — business-model transformation, not point tools, as the client opportunity. · Open the full presentation →p. 83 — Management's counter-narrative — in past productivity waves demand for builders rose, and AI will do the same. · Open the full presentation →p. 89 — How the workforce is retooled at scale — training platforms and the reach of EPAM's AI-upskilling programs. · Open the full presentation →p. 93 — The talent engine — a sense/develop/deploy model for building skills that don't yet exist in the market. · Open the full presentation →p. 98 — The proof in retention — EPAM attrition, tenure and NPS against industry benchmarks. · Open the full presentation →p. 103 — The starting point — end-2021 delivery, with 59% of professionals in Ukraine, Belarus and Russia. · Open the full presentation →p. 104 — The pivot — by end-2025 that concentration is down to 21%, delivery rebalanced across the globe. · Open the full presentation →p. 111 — How delivery actually works — in-market, nearshore and offshore mix by client region across US, EU, India and LATAM. · Open the full presentation →p. 123 — The financial through-line — revenue, non-GAAP operating income and EPS from 2022 through the 2026 estimate. · Open the full presentation →p. 127 — The three-year growth target — a path back to double-digit revenue growth and the drivers behind it. · Open the full presentation →p. 128 — The margin target — a return to 16%+ non-GAAP operating margin by 2028 and how it is built. · Open the full presentation →p. 129 — Cash generation — free cash flow, conversion rates, and the ~$1.8B+ cumulative target through 2028. · Open the full presentation →p. 130 — The balance sheet and capital plan — $1.3B cash, minimal debt, and how cash is split across reinvestment, buybacks and M&A. · Open the full presentation →p. 138 — The closing case — the winner-in-AI thesis alongside the concrete 2028 financial goals. · Open the full presentation →
The most current overview deck — a fast zero-to-understanding tour of the business plus the latest Q1 2026 results and full-year guidance. · Open the full document →
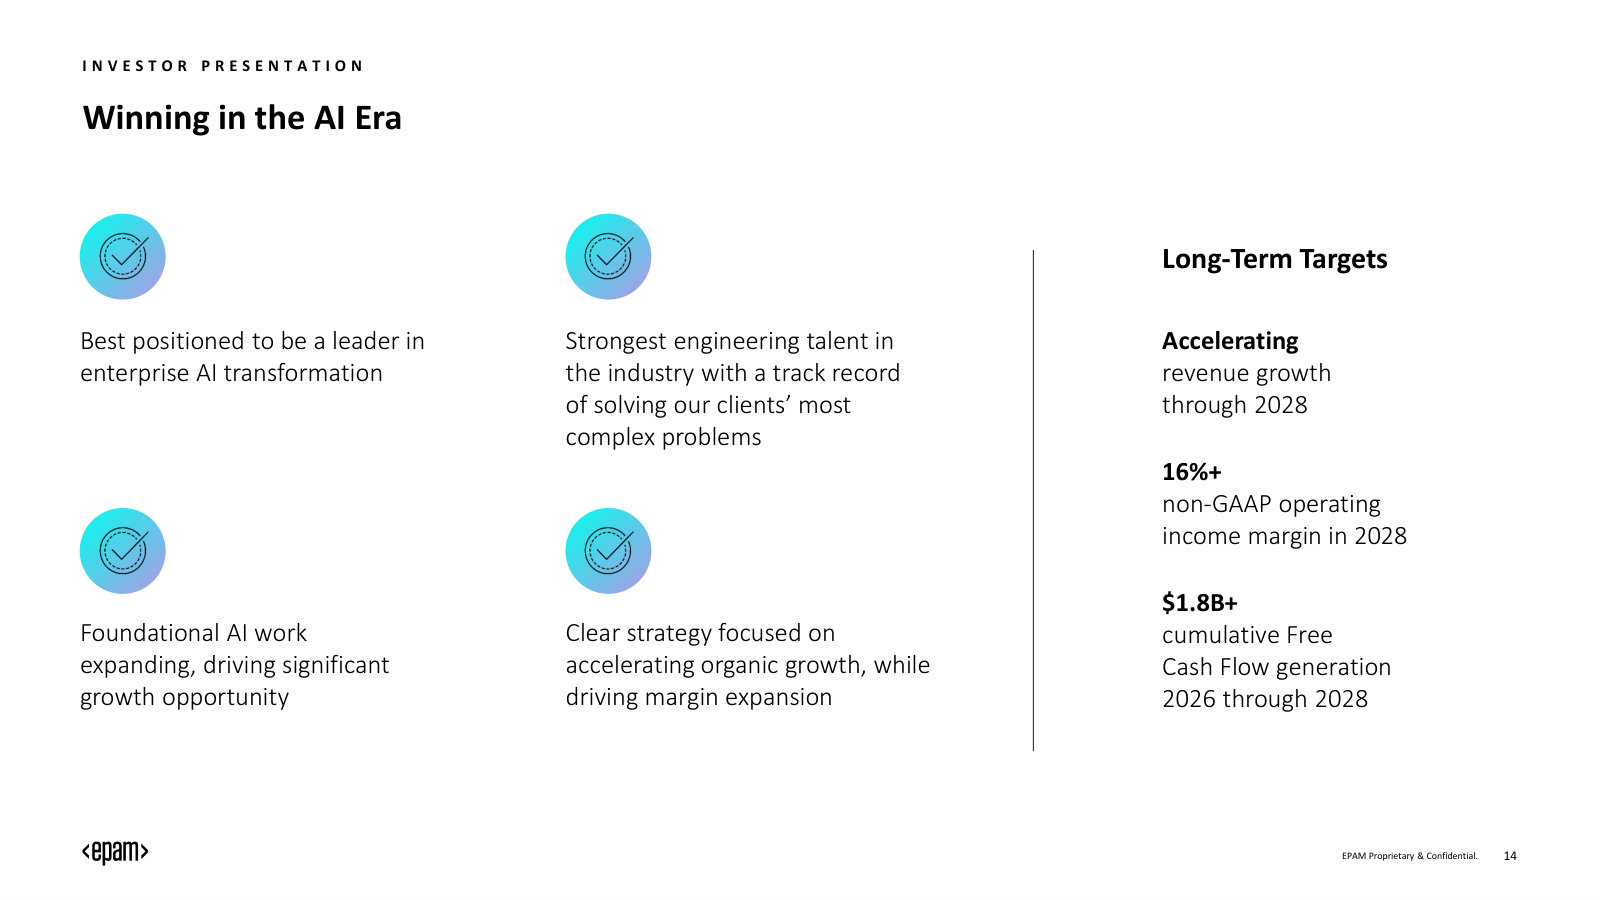
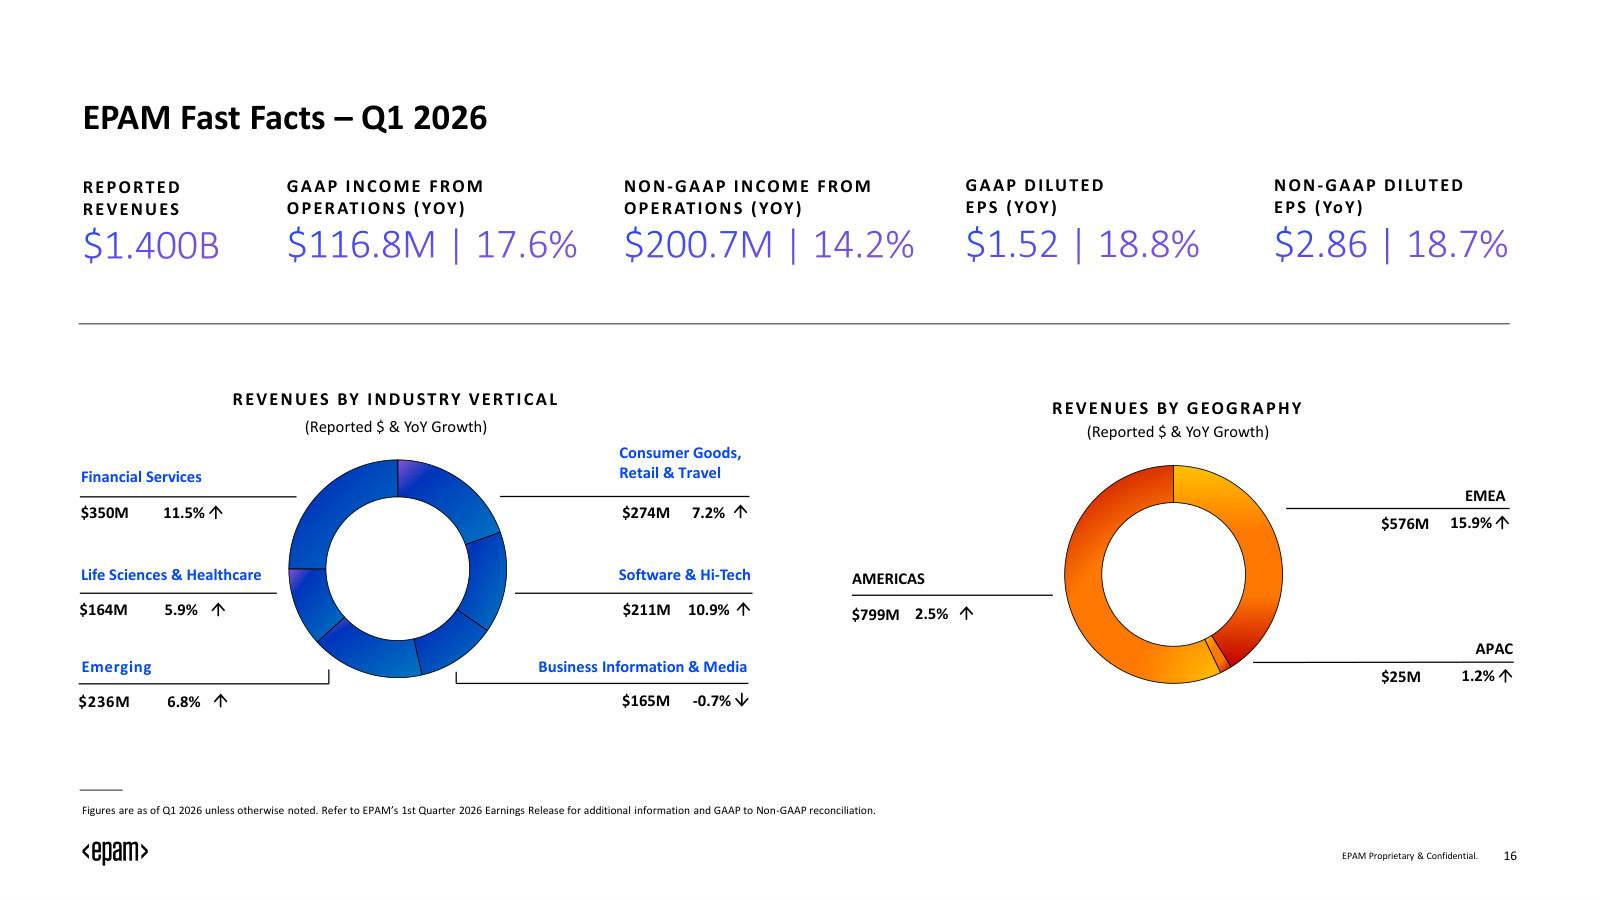
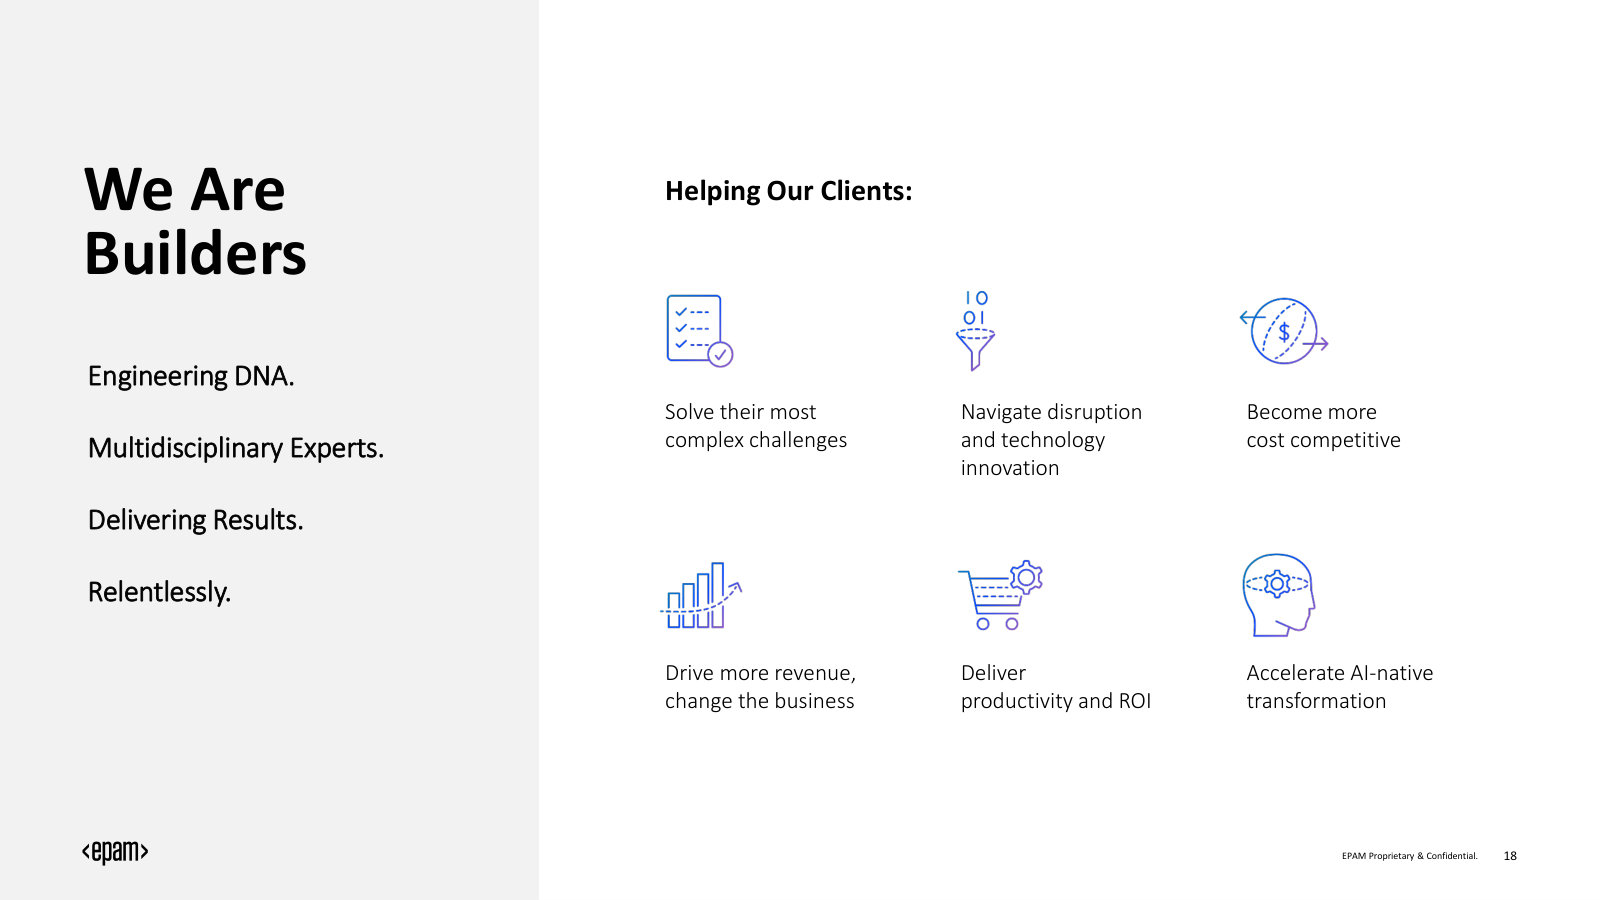
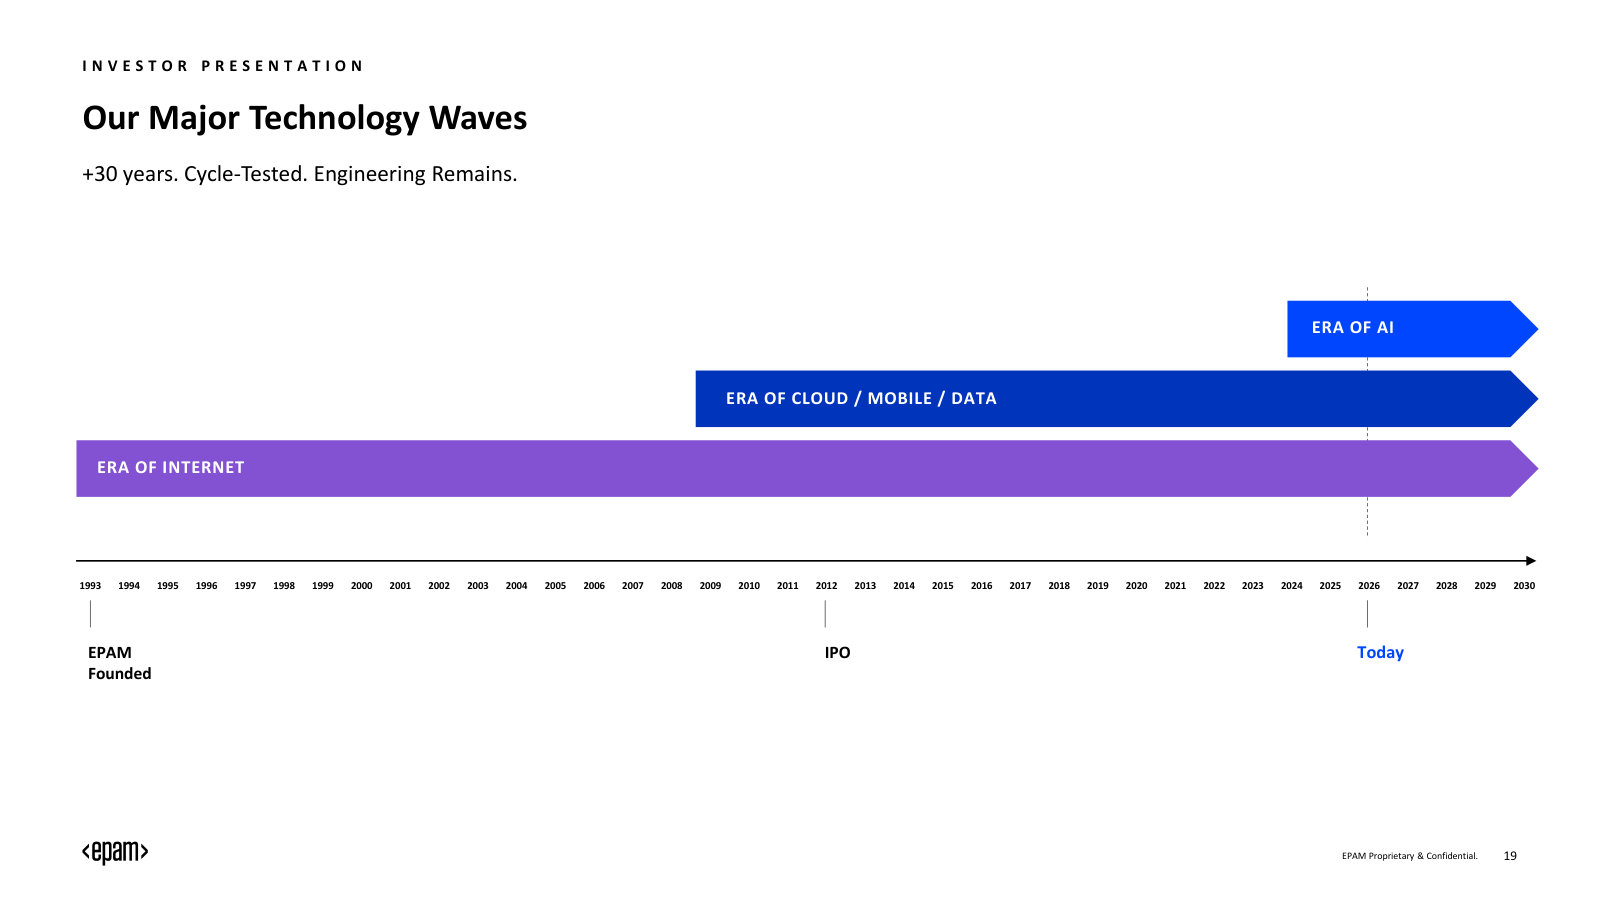
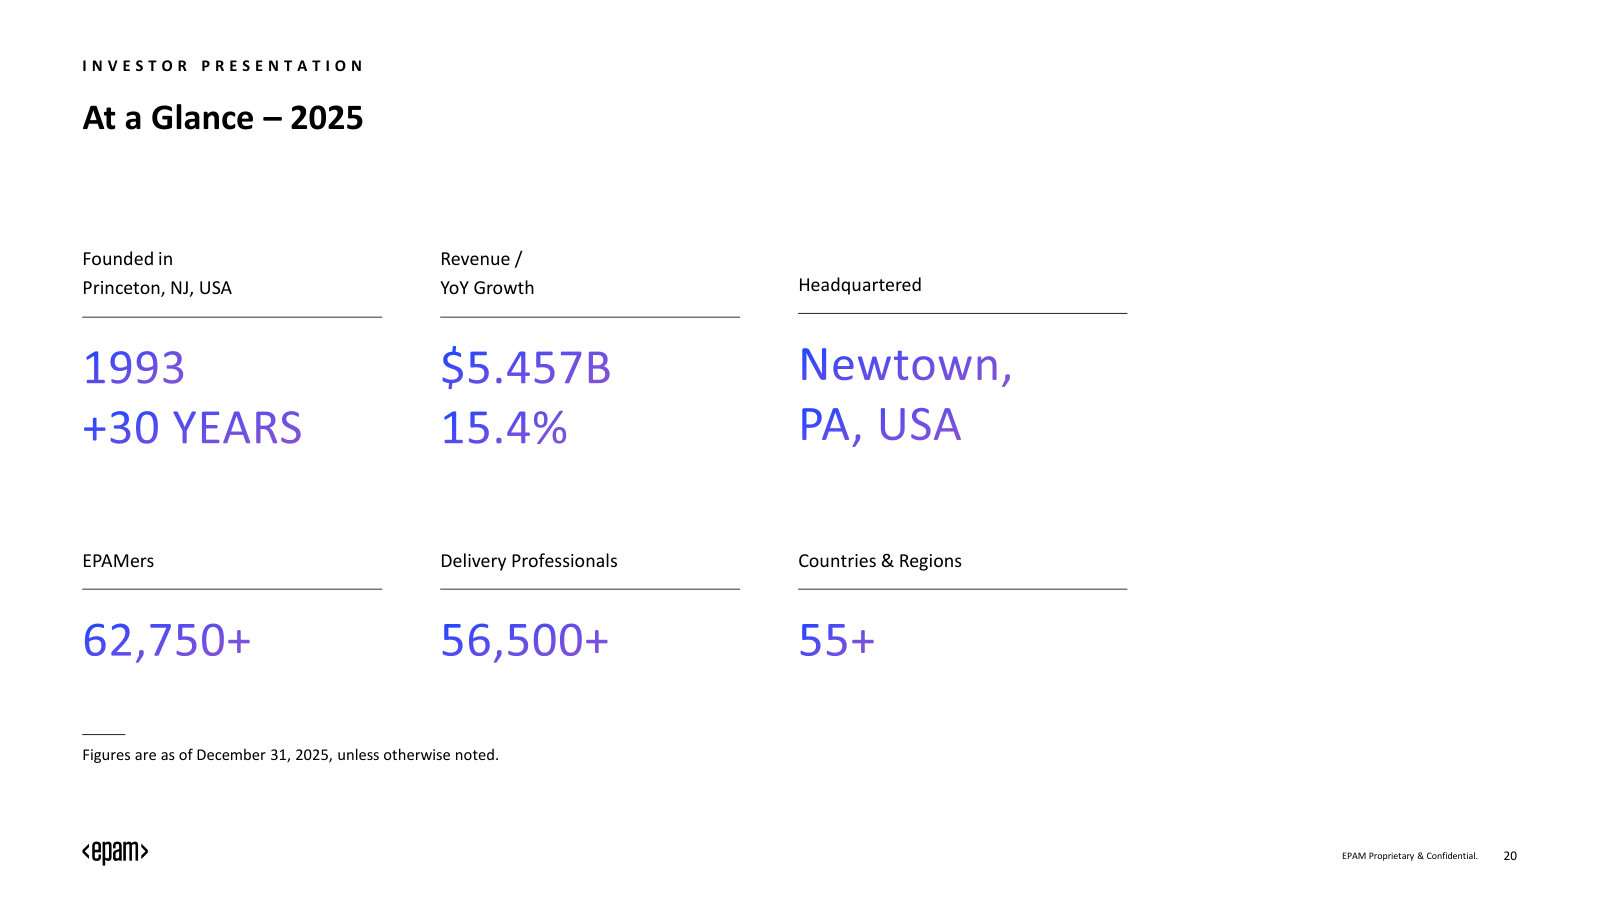
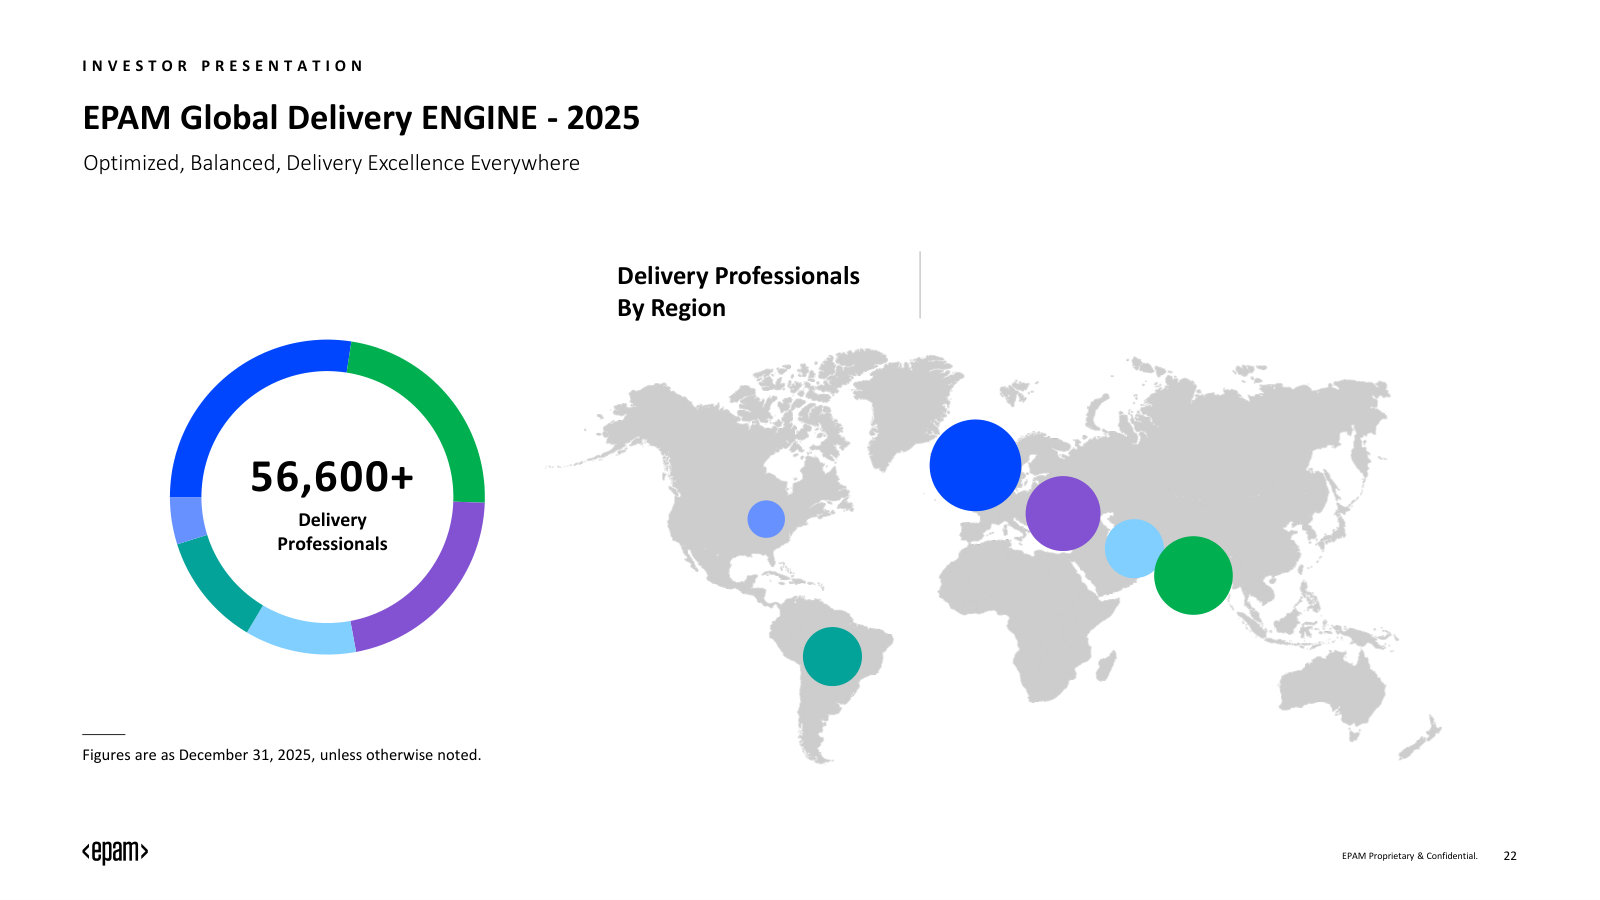
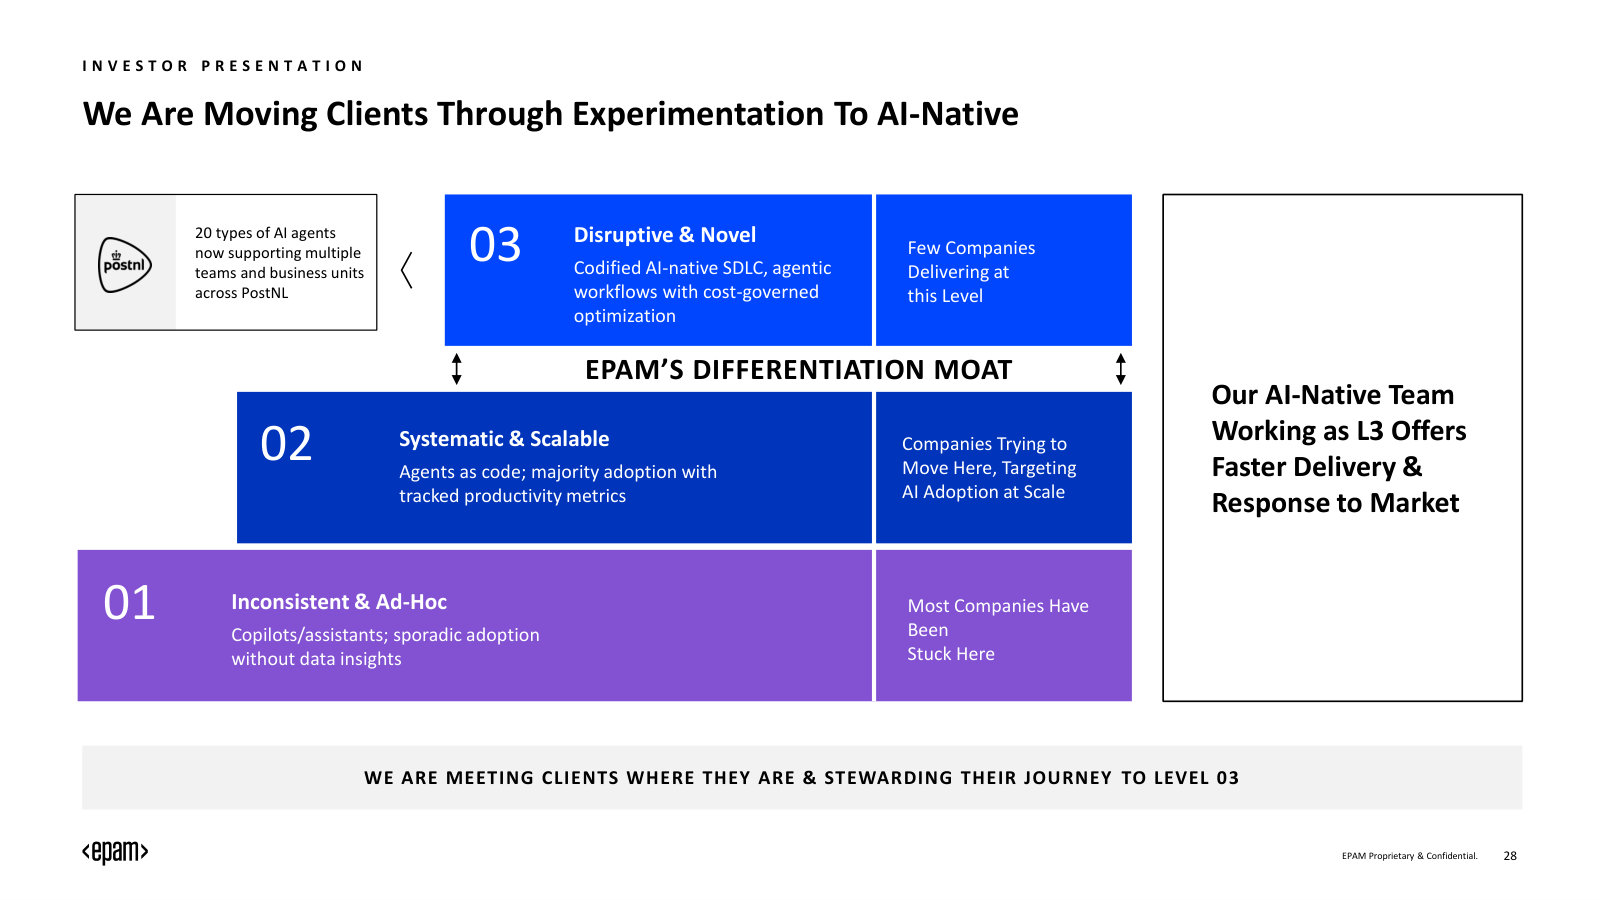
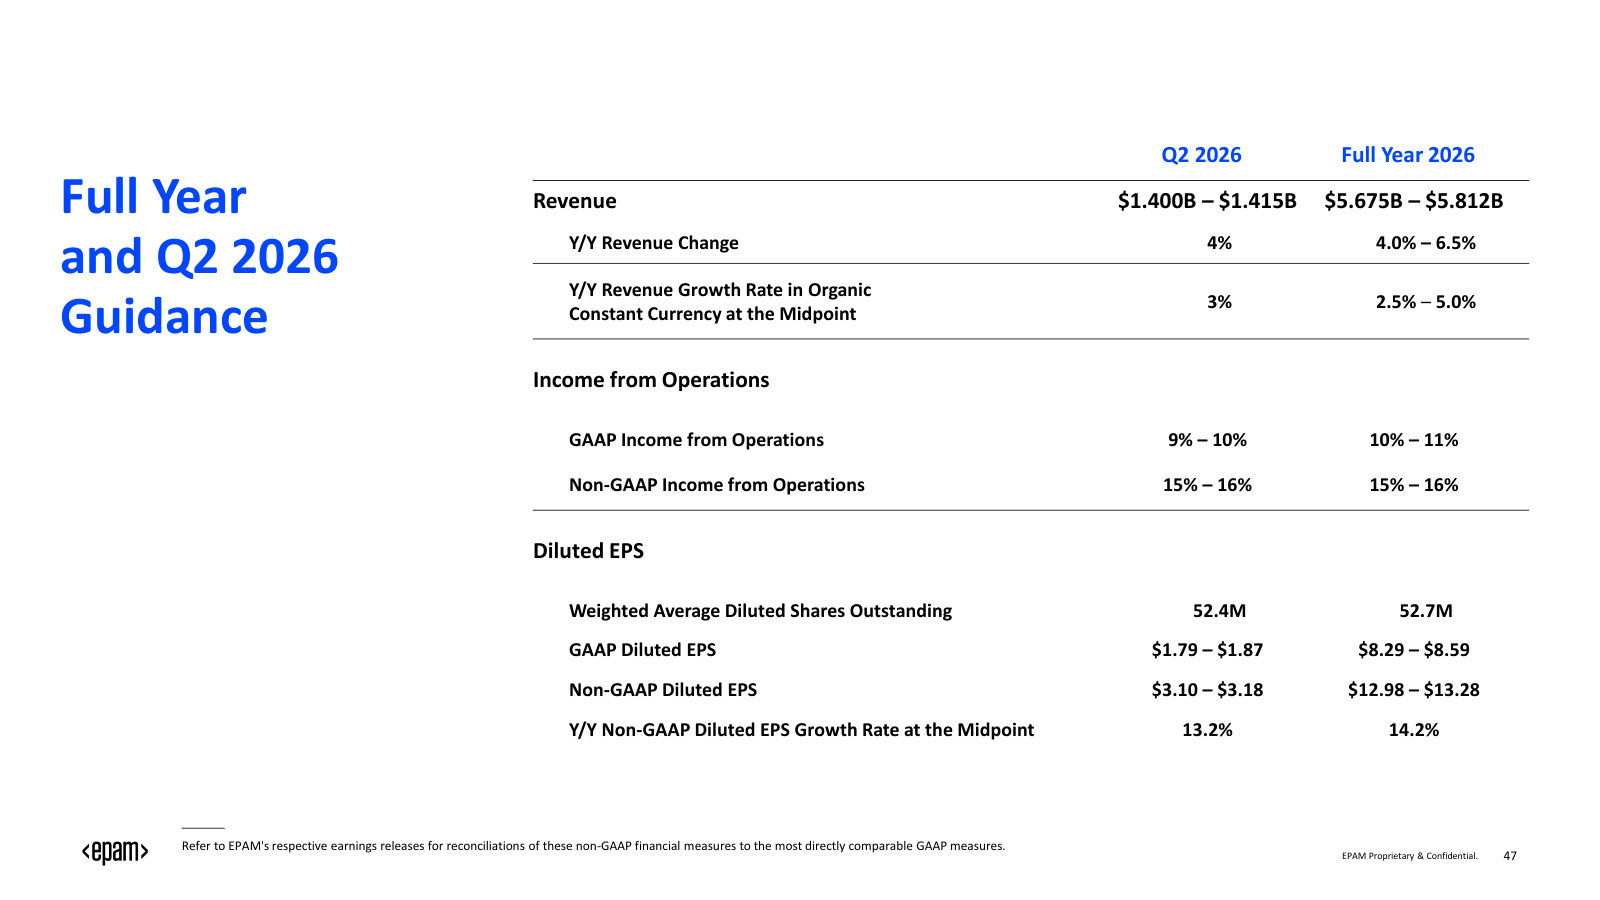
p. 5 — The one-slide pitch — why management thinks EPAM leads enterprise AI, with the long-term financial targets attached. · Open the full presentation →p. 7 — The latest quarter at a glance — Q1 2026 revenue, margins and EPS with the vertical and geographic mix. · Open the full presentation →p. 9 — What EPAM does, in its own words — an engineering-first firm helping clients build and run complex systems. · Open the full presentation →p. 10 — Thirty years across technology waves — the 'cycle-tested' framing management uses to position for AI. · Open the full presentation →p. 11 — The company by the numbers — 2025 revenue, headcount, delivery footprint and history on one page. · Open the full presentation →p. 12 — Where the money comes from — full-year 2025 revenue by industry vertical and by region. · Open the full presentation →p. 13 — The delivery footprint — 56,500+ delivery professionals spread across regions, shown on a map. · Open the full presentation →p. 14 — The client base — industries served, share of the Forbes Global 2000, and relationship tenure. · Open the full presentation →p. 16 — The opportunity framing — the cycle-tested strengths management believes let EPAM win in the AI era. · Open the full presentation →p. 17 — The strategy — the aspiration to be the go-to enterprise-AI partner and the pillars supporting it. · Open the full presentation →p. 19 — How clients are moved from AI experiments to AI-native, and where EPAM adds value along the way. · Open the full presentation →p. 22 — Three brands, three buyers — how EPAM, Empathy Lab and EPAM Continuum target different decision-makers. · Open the full presentation →p. 23 — The productized offering — AI/Run blueprints and playbooks that package delivery from code to transformation. · Open the full presentation →p. 35 — The financial story — revenue, operating income and EPS returning to growth through 2026. · Open the full presentation →p. 36 — Cash generation — a history of robust free cash flow and the conversion target through 2028. · Open the full presentation →p. 37 — How cash is used — the balance between reinvestment, share buybacks and M&A. · Open the full presentation →p. 38 — The current numbers to hold management to — Q2 and full-year 2026 revenue and margin guidance. · Open the full presentation →