Full Report
The numbers behind EPAM Systems, Inc.: as-reported financial statements and company metrics for FY2021–FY2025, traced to the source filings, opened with the share-price history those statements have to justify. Every linked figure opens the exact page of the filing it was printed on, with the statement row highlighted. Amounts in US$ thousands unless noted.
Reading notes: All figures are in thousands of U.S. dollars, as printed in EPAM's Consolidated Financial Statements (each 10-K states '(In thousands, except per share data)'). Main statement columns FY2021–FY2025 are all verified to filing pages. FY2025/FY2024 from the FY2025 Form 10-K; FY2023 income/revenue/segment from the FY2025 10-K comparative column, FY2023 balance sheet and cash flow from the FY2023 Form 10-K; FY2022 and FY2021 from the FY2022 Form 10-K. Long-Term Record FY2016–FY2020 figures are from the standardized data feed (SEC XBRL) and are shown without page links; FY2021–FY2025 are cited to filing pages. Revenue by Industry Vertical uses EPAM's current (FY2025) vertical labels. The 'Consumer Goods, Retail and Travel' vertical was labeled 'Travel Consumer' in the FY2022 10-K (a rename, not a restatement); the FY2021/FY2022 quotes reference that prior label.
Share Price — Full Available History — 14 Years
The stock closed at $86.38 on Jul 13, 2026 — up 517% over the window shown (+13.4% a year), trading between $13.40 and $717.49. At that close the stock trades at 13× FY2025 diluted EPS as reported below.
Source: market price feed, monthly closes, sampled from 3,626 source observations, Feb 2012–Jul 2026. Price return only, excludes dividends. Note: the series shows a 46% single-day move around 2022-02-28 that may be an unadjusted corporate action — no split record was available to verify.
Market capitalization $4.6bn and enterprise value $3.3bn.
Market cap = 53.2M shares outstanding × the Jul 13, 2026 close of $86.38. Enterprise value adds total debt of $25mn and subtracts cash and equivalents of $1.3bn (net cash of $1.3bn), from the FY2025 balance sheet. Market-derived figures, shown without filing links.
FY2025 at a Glance
Revenue (US$ thousands)
Net income (US$ thousands)
Diluted EPS
Source: FY2025 consolidated statements [1] [2]. Click any linked figure to open the filing page with the row highlighted.
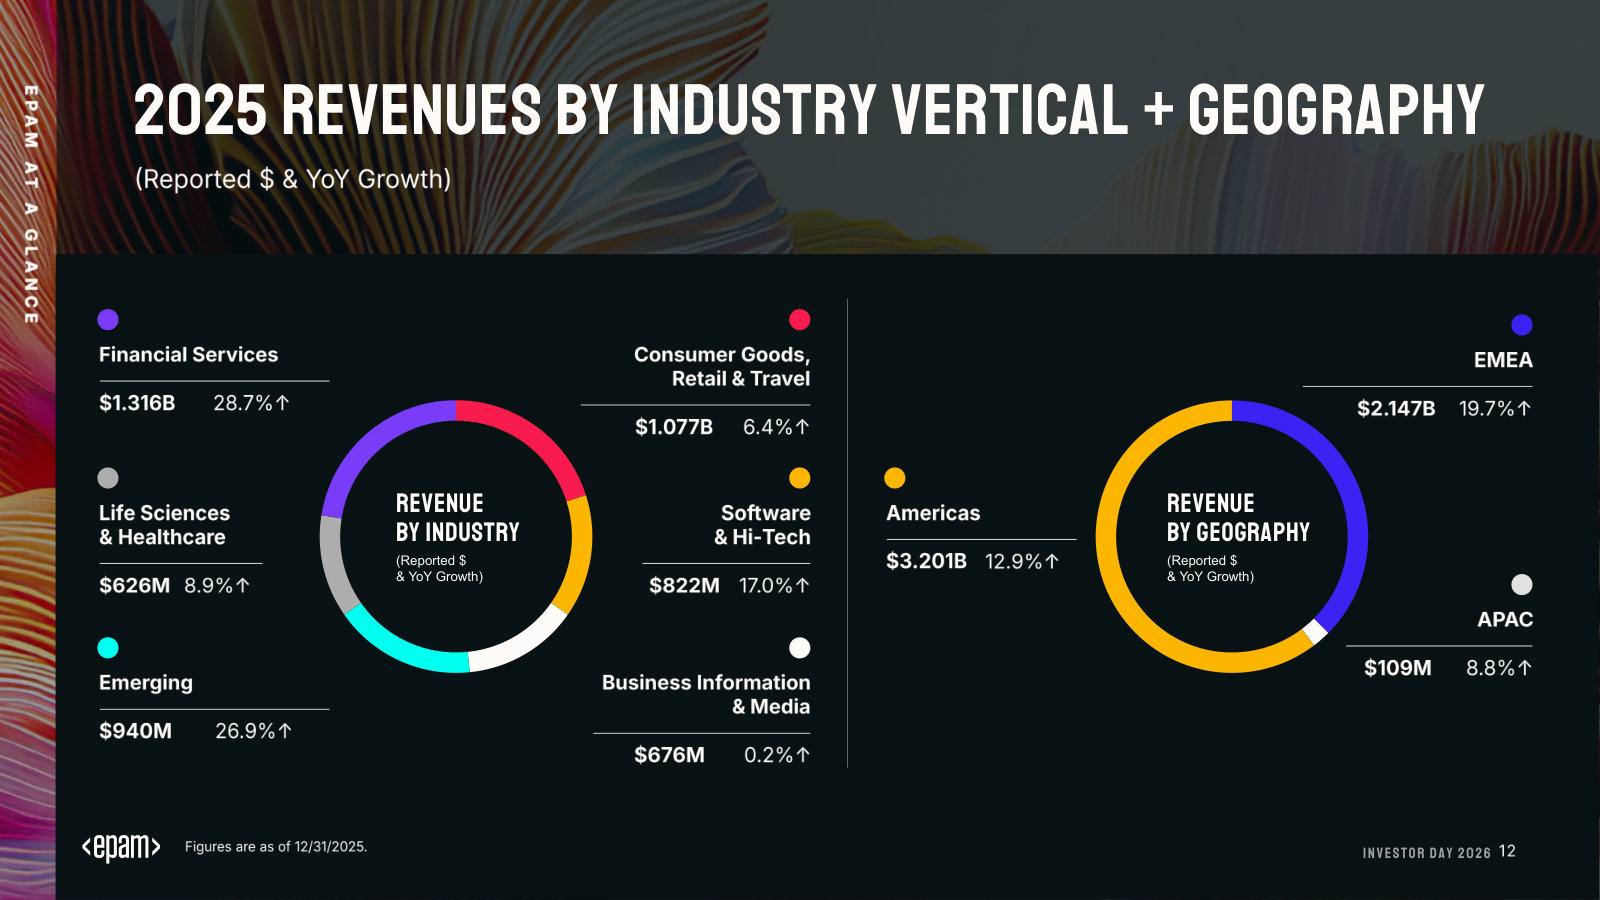
Revenue by Industry Vertical
| Revenue by Industry Vertical | FY2021 | FY2022 | FY2023 | FY2024 | FY2025 |
|---|---|---|---|---|---|
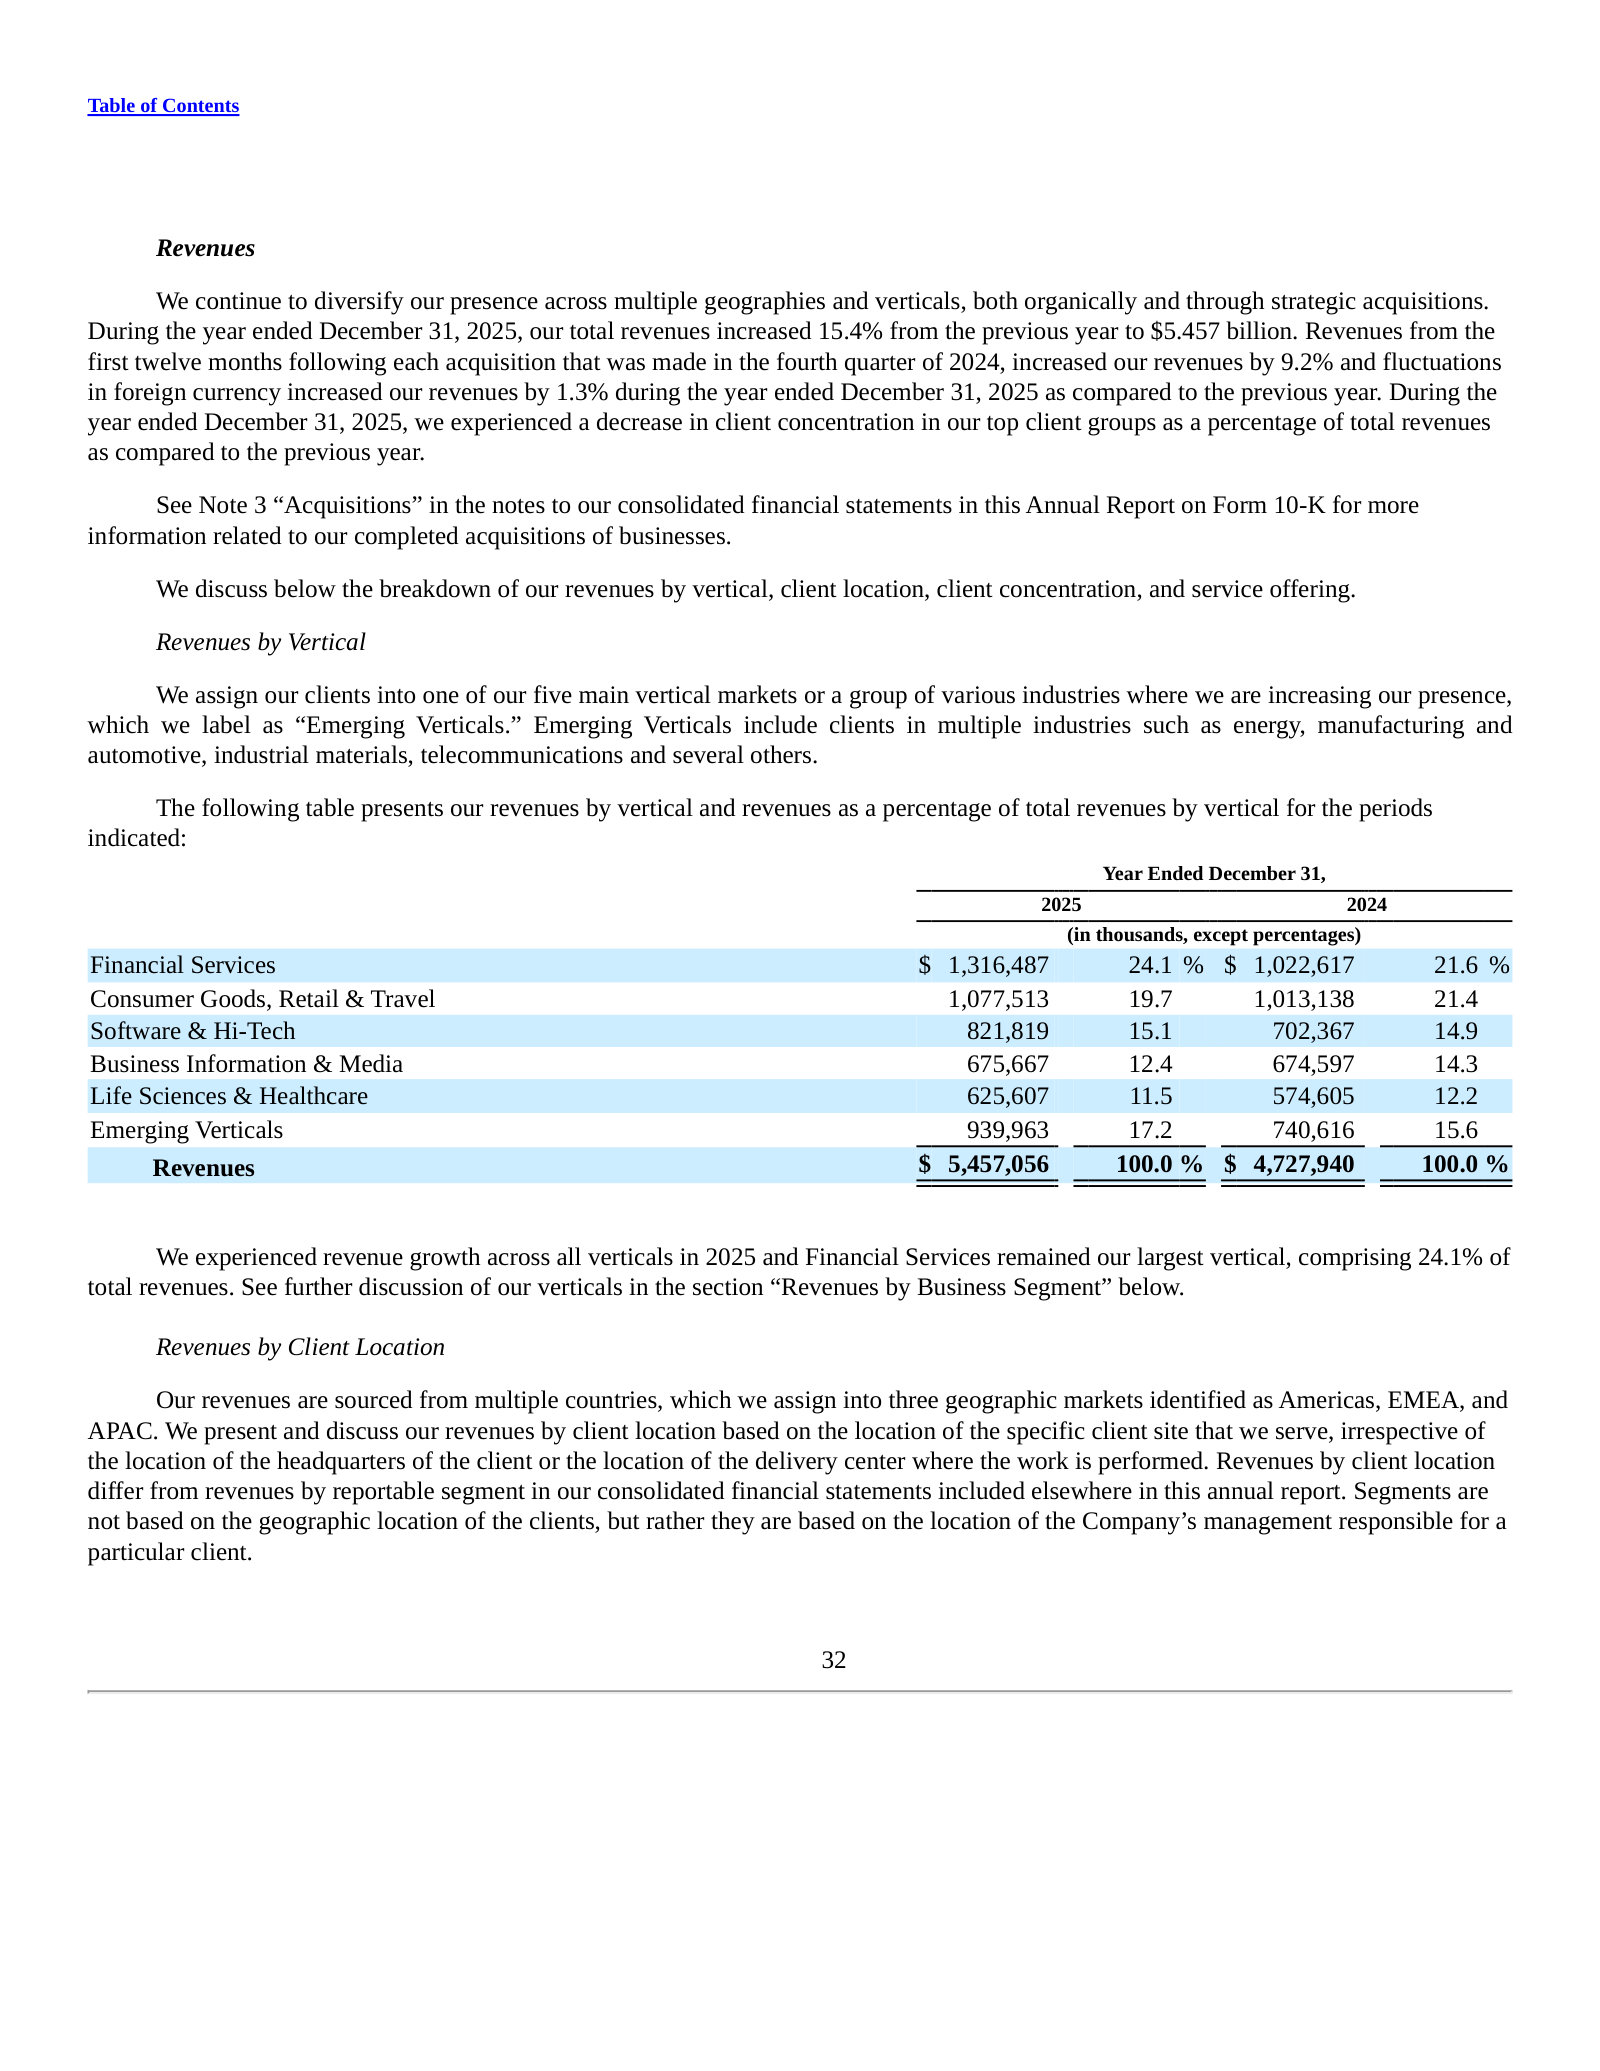
| Financial Services | 848,370 | 1,026,686 | 1,018,433 | 1,022,617 | 1,316,487 |
| Consumer Goods, Retail and Travel | 741,128 | 1,092,224 | 1,072,950 | 1,013,138 | 1,077,513 |
| Software and Hi-Tech | 664,597 | 793,261 | 707,720 | 702,367 | 821,819 |
| Business Information and Media | 666,941 | 809,952 | 753,981 | 674,597 | 675,667 |
| Life Sciences and Healthcare | 391,309 | 507,367 | 489,914 | 574,605 | 625,607 |
| Emerging Verticals | 445,799 | 595,208 | 647,542 | 740,616 | 939,963 |
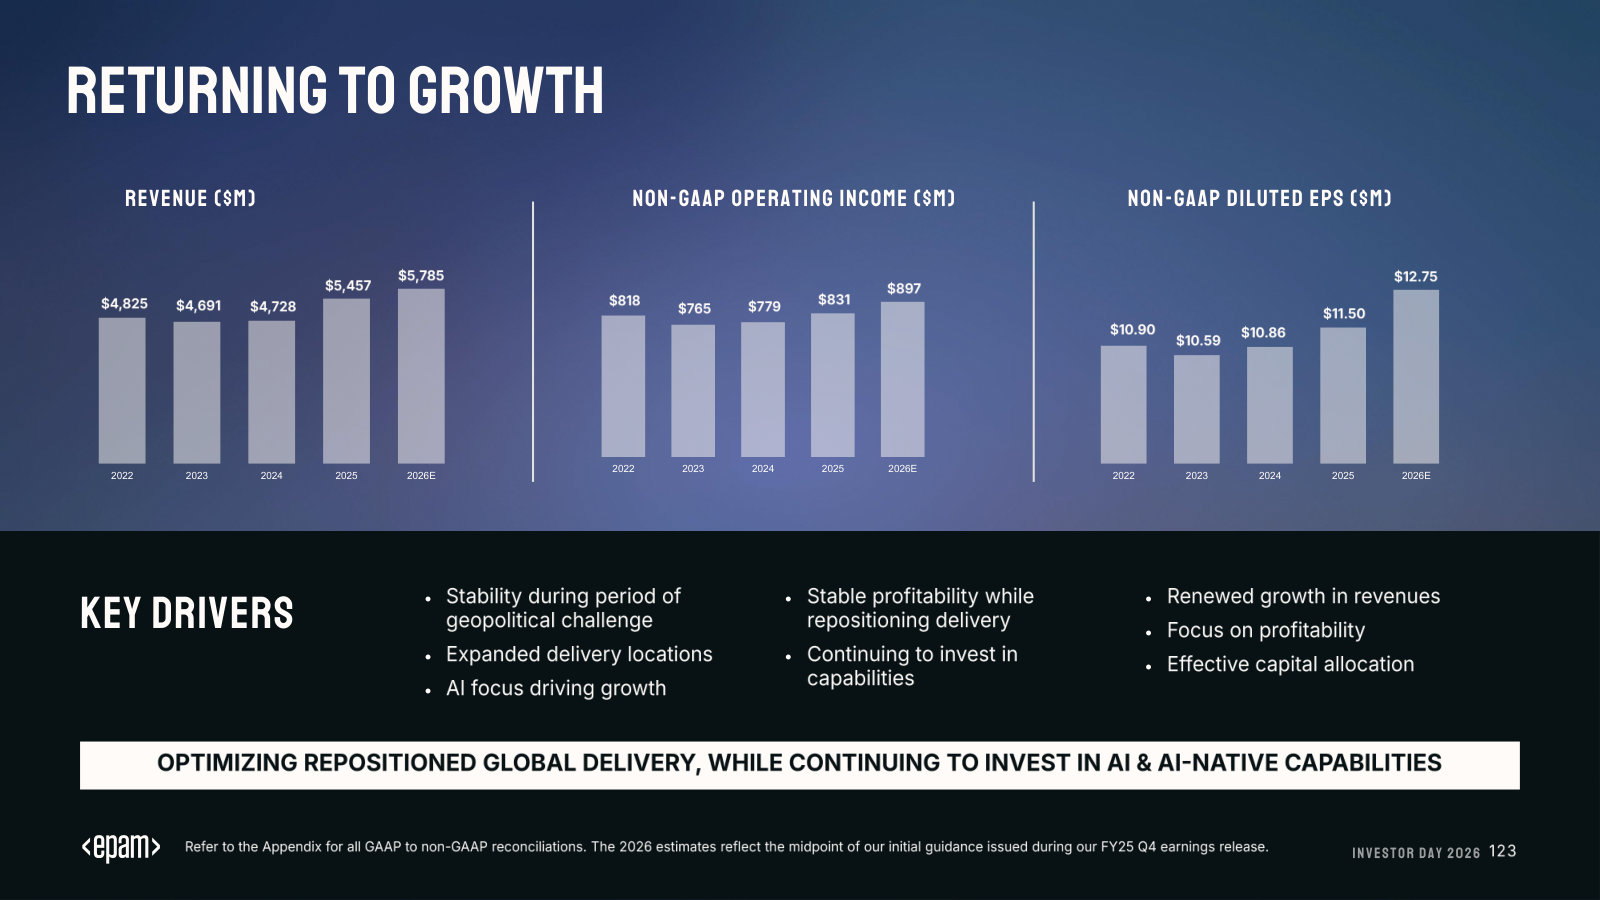
| Total revenues | 3,758,144 | 4,824,698 | 4,690,540 | 4,727,940 | 5,457,056 |
| Total revenues growth, derived | — | +28.4% | -2.8% | +0.8% | +15.4% |
Source: Note 13 (Note 12 in FY2022) Revenues — Disaggregation of Revenues by industry vertical, consolidated [3] [4]. Click any linked figure to open the filing page with the row highlighted.
Results by Reportable Segment
| Results by Reportable Segment | FY2021 | FY2022 | FY2023 | FY2024 | FY2025 |
|---|---|---|---|---|---|
| Americas — segment revenues | 2,242,248 | 2,898,554 | 2,765,022 | 2,866,339 | 3,166,116 |
| Europe — segment revenues | 1,350,484 | 1,853,056 | 1,909,443 | 1,861,601 | 2,290,940 |
| Americas — segment operating profit | 462,798 | 589,412 | 511,030 | 541,424 | 522,115 |
| Europe — segment operating profit | 233,727 | 223,276 | 250,224 | 284,176 | 332,953 |
| Total segment operating profit | 729,072 | 799,228 | 756,184 | 825,600 | 855,068 |
Source: Note 19 (Note 17 in FY2022) Segment Information [5] [6] [7]. Click any linked figure to open the filing page with the row highlighted.
Income Statement
Source: Consolidated Statements of Income [1] [2]. Click any linked figure to open the filing page with the row highlighted.
Columns marked E are consensus analyst estimates from S&P Capital IQ (CapIQ), shown alongside reported results for direct comparison; they are not company guidance.
Estimate source: S&P Capital IQ (CapIQ) consensus, as of 2026-07-22. Estimate figures are S&P Capital IQ consensus (vendor data — no filing page links). EPS and net income use the normalized (adjusted) consensus where the street reports it. Line-item analyst models (segments, drivers, KPIs) are in the Visible Alpha tab.
Balance Sheet
Source: Consolidated Balance Sheets [8] [9] [10]. Click any linked figure to open the filing page with the row highlighted.
Cash Flow
Source: Consolidated Statements of Cash Flows [11] [12] [13]. Click any linked figure to open the filing page with the row highlighted.
Talent Delivery
| Talent Delivery | FY2021 | FY2022 | FY2023 | FY2024 | FY2025 |
|---|---|---|---|---|---|
| Total employees | 58,800 | 59,300 | 53,150 | 61,200 | 62,850 |
| Delivery professionals | 52,600 | 52,850 | 47,350 | 55,100 | 56,600 |
| Utilization rate of delivery professionals | 78.7% | 75.8% | 74.3% | 76.7% | 76.8% |
| Voluntary attrition rate | 13.3% | 13.8% | 8.6% | 8.9% | 8.5% |
Source: company filings [14] [15] [16] [17]. Click any linked figure to open the filing page with the row highlighted.
Client Concentration Base
| Client Concentration Base | FY2021 | FY2022 | FY2023 | FY2024 | FY2025 |
|---|---|---|---|---|---|
| Top five clients (% of revenues) | 18.2% | 16.4% | 16.6% | 15.8% | 13.7% |
| Top ten clients (% of revenues) | 25.7% | 23.8% | 23.6% | 23.4% | 21.6% |
| Top twenty clients (% of revenues) | 37.1% | 35.2% | 35.4% | 34.2% | 31.9% |
| Clients over $20 million (count) | 40 | 49 | 44 | 43 | 53 |
| Clients contributing $1–$5 million (count) | 271 | 303 | 305 | 331 | 375 |
Source: company filings [18] [19] [20]. Click any linked figure to open the filing page with the row highlighted.
Delivery Footprint (delivery professionals by location)
| Delivery Footprint (delivery professionals by location) | FY2021 | FY2022 | FY2023 | FY2024 | FY2025 |
|---|---|---|---|---|---|
| India | — | 5,900 | 7,050 | 10,072 | 12,200 |
| Ukraine | — | 10,500 | 9,113 | 8,764 | 8,750 |
| Poland | — | 5,650 | 5,400 | 5,000 | 5,050 |
| Belarus | — | 4,500 | 3,500 | 3,350 | 3,400 |
Source: company filings [21] [22] [23] [17]. Click any linked figure to open the filing page with the row highlighted.
Long-Term Record
| Fiscal year | Total revenue | Income from operations | Net income | Diluted EPS | Operating cash flow |
|---|---|---|---|---|---|
| FY2016 | 1,160,132 | 133,696 | 99,266 | 1.87 | 167,217 |
| FY2017 | 1,450,448 | 172,946 | 72,760 | 1.32 | 192,820 |
| FY2018 | 1,842,912 | 245,764 | 240,256 | 4.24 | 292,218 |
| FY2019 | 2,293,798 | 302,850 | 261,057 | 4.53 | 287,453 |
| FY2020 | 2,659,478 | 379,324 | 327,160 | 5.60 | 544,407 |
| FY2021 | 3,758,144 | 542,316 | 481,652 | 8.15 | 572,327 |
| FY2022 | 4,824,698 | 572,966 | 419,416 | 7.09 | 464,104 |
| FY2023 | 4,690,540 | 501,239 | 417,083 | 7.06 | 562,634 |
| FY2024 | 4,727,940 | 544,584 | 454,533 | 7.84 | 559,168 |
| FY2025 | 5,457,056 | 520,003 | 377,678 | 6.72 | 654,934 |
Source: consolidated statements across filings; older years from the standardized feed [11] [1] [12] [13]. Click any linked figure to open the filing page with the row highlighted.
Analyst Consensus
Mean target
Median target
High target
Low target
Street ratings: 8 strong buy, 3 buy, 8 hold. Consensus: Buy.
Estimate source: S&P Capital IQ (CapIQ) consensus, as of 2026-07-22. Estimate figures are S&P Capital IQ consensus (vendor data — no filing page links). EPS and net income use the normalized (adjusted) consensus where the street reports it. Line-item analyst models (segments, drivers, KPIs) are in the Visible Alpha tab.
Traceability
333 of 358 figures on this page (93%) link to the filing page where they are printed — click a linked figure to open the source PDF at that page with the row highlighted. Unlinked figures come from standardized data feeds or pre-filing years.
All figures are in thousands of U.S. dollars, as printed in EPAM's Consolidated Financial Statements (each 10-K states '(In thousands, except per share data)').
Main statement columns FY2021–FY2025 are all verified to filing pages. FY2025/FY2024 from the FY2025 Form 10-K; FY2023 income/revenue/segment from the FY2025 10-K comparative column, FY2023 balance sheet and cash flow from the FY2023 Form 10-K; FY2022 and FY2021 from the FY2022 Form 10-K.
Long-Term Record FY2016–FY2020 figures are from the standardized data feed (SEC XBRL) and are shown without page links; FY2021–FY2025 are cited to filing pages.
Revenue by Industry Vertical uses EPAM's current (FY2025) vertical labels. The 'Consumer Goods, Retail and Travel' vertical was labeled 'Travel Consumer' in the FY2022 10-K (a rename, not a restatement); the FY2021/FY2022 quotes reference that prior label.
In 2025 EPAM renamed its 'North America' reportable segment to 'Americas' (naming change only; prior amounts unchanged). The Americas segment rows for FY2021/FY2022 cite the 'North America' rows of the FY2022 10-K.
Total segment operating profit for FY2021–FY2023 includes the former Russia segment (FY2021 +32,547; FY2022 -13,460; FY2023 -5,070), which is not shown as a separate row; therefore no component-sum check is applied to that total. EPAM exited its Russia operations on July 26, 2023.
The FY2025 10-K cash-flow page (p.72) truncates the FY2023 comparative column in the parsed text, so FY2023 cash-flow figures are cited to the FY2023 10-K (p.72) where they print in full.
No material discrepancies were found between the filings and the standardized numeric feed; all cross-checked line items agree to the dollar (in thousands).
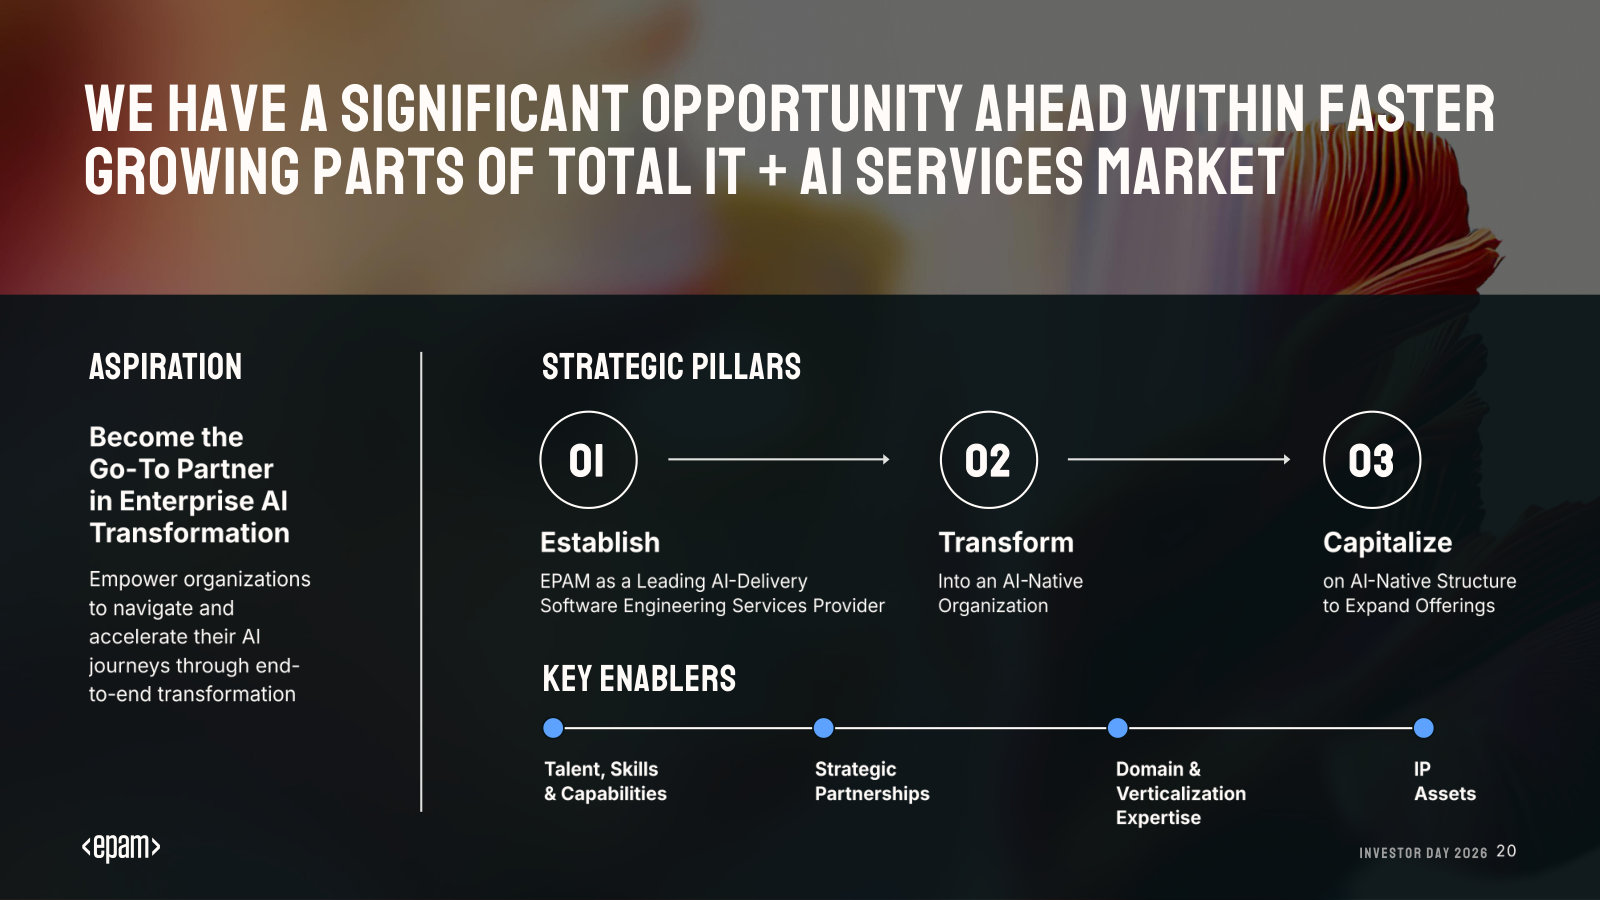
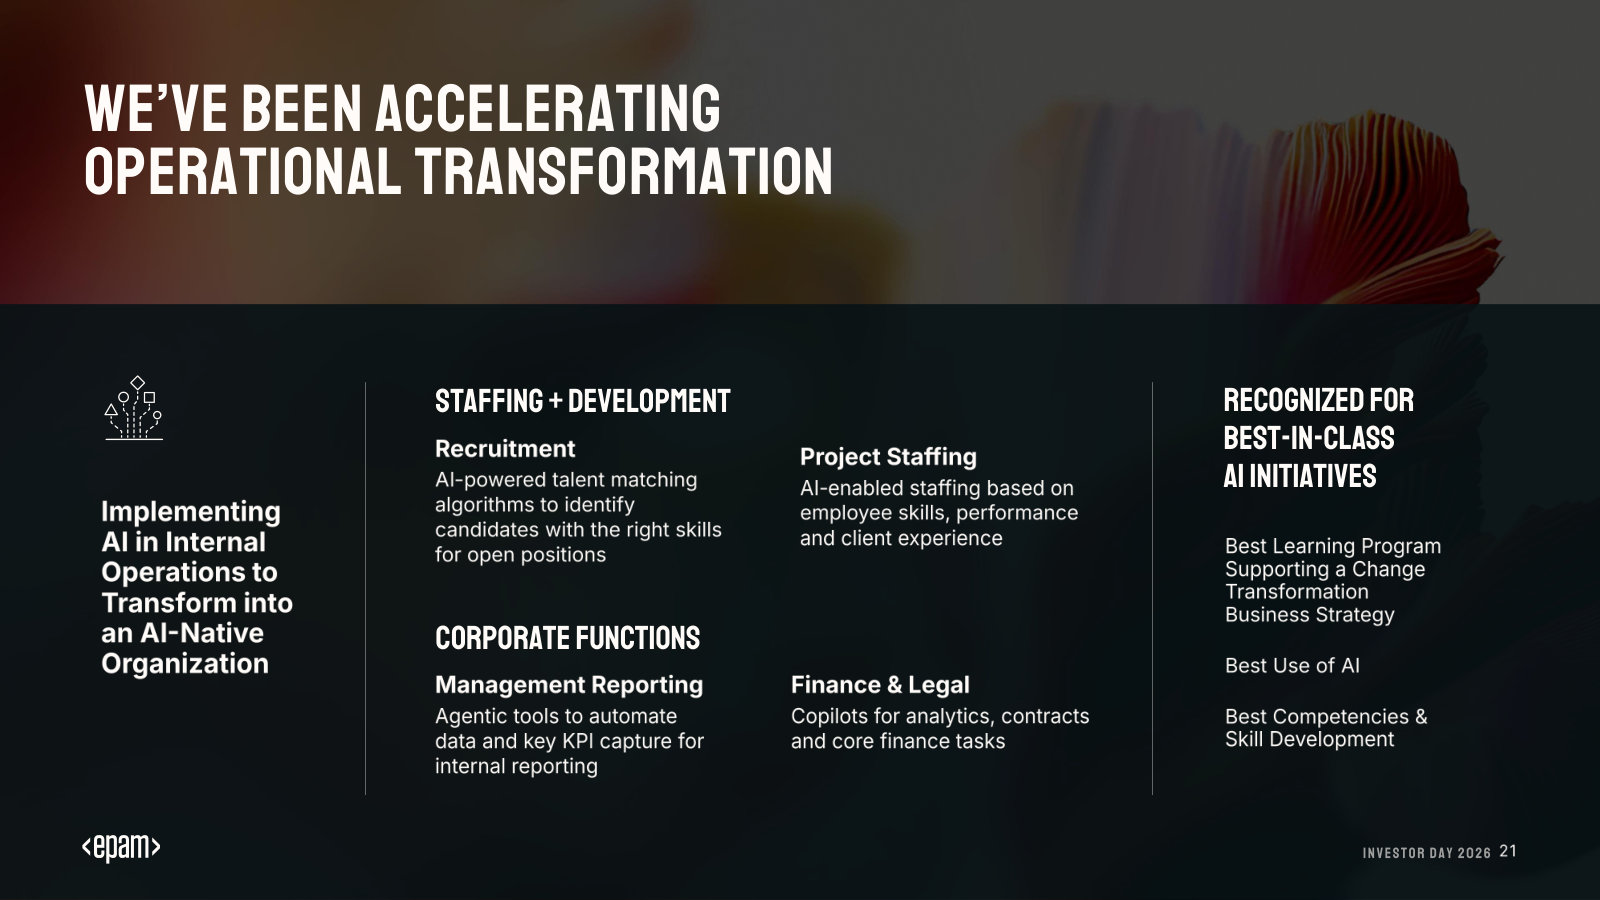
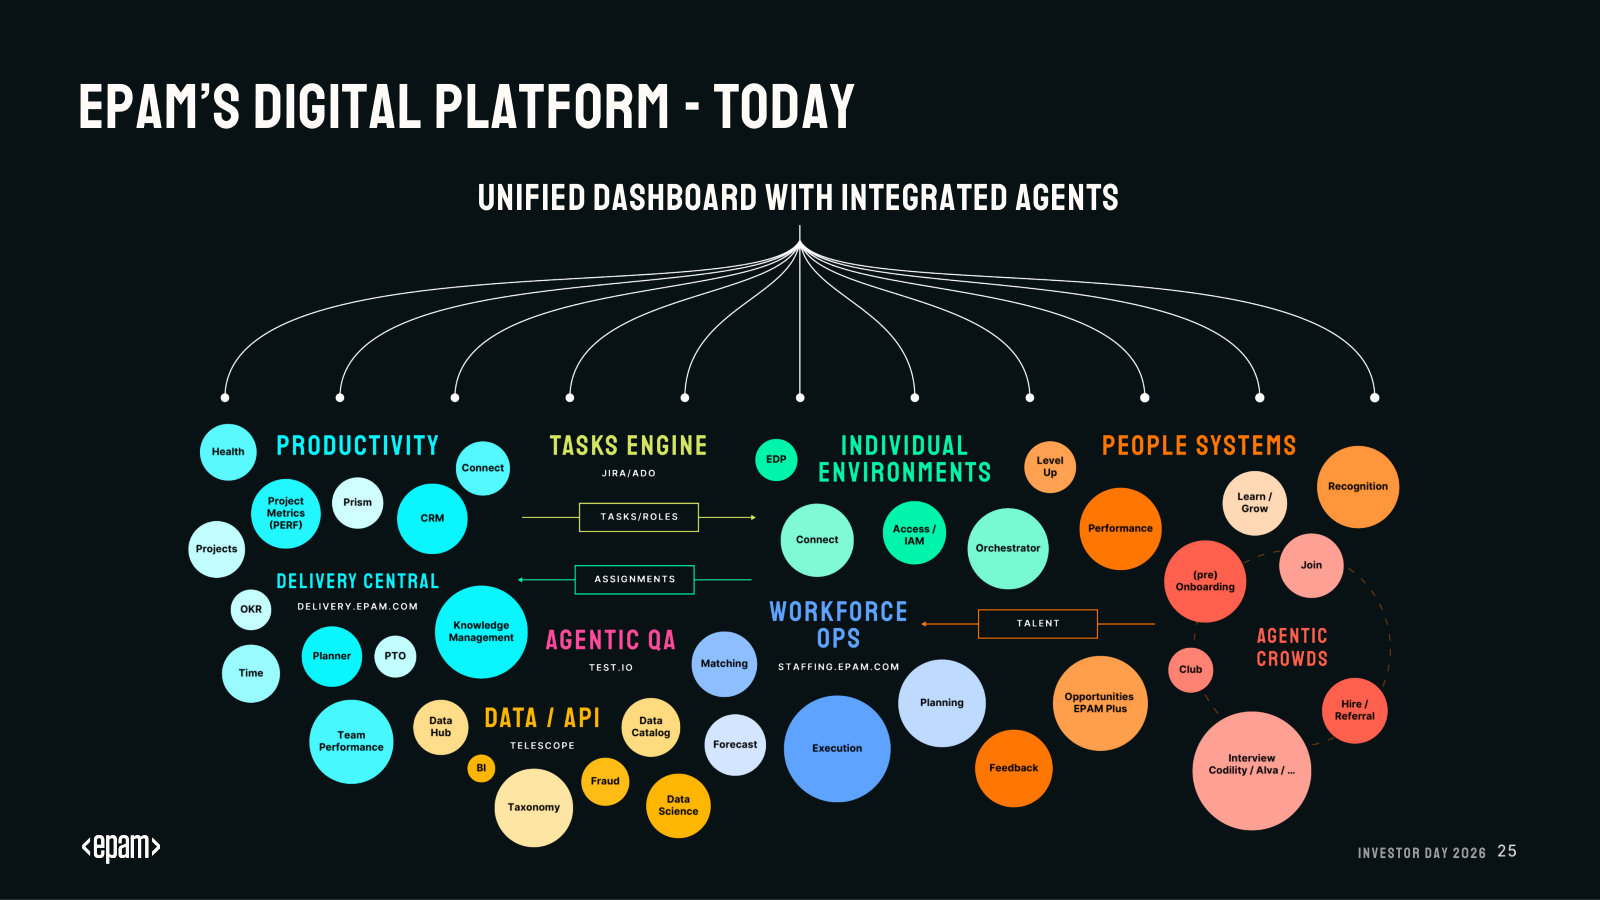
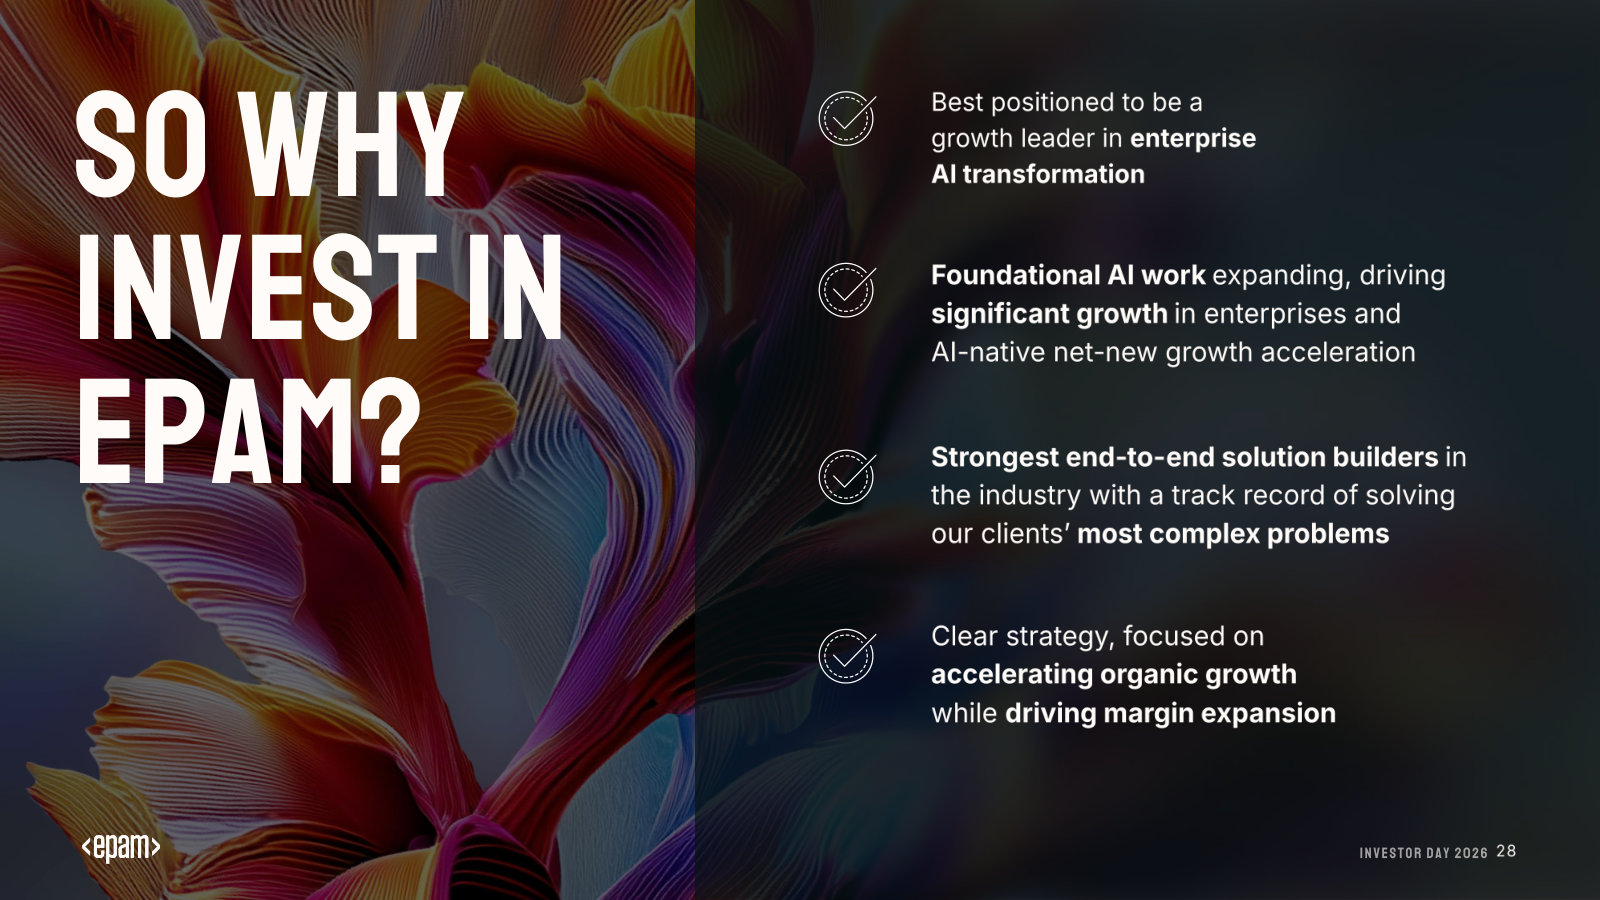
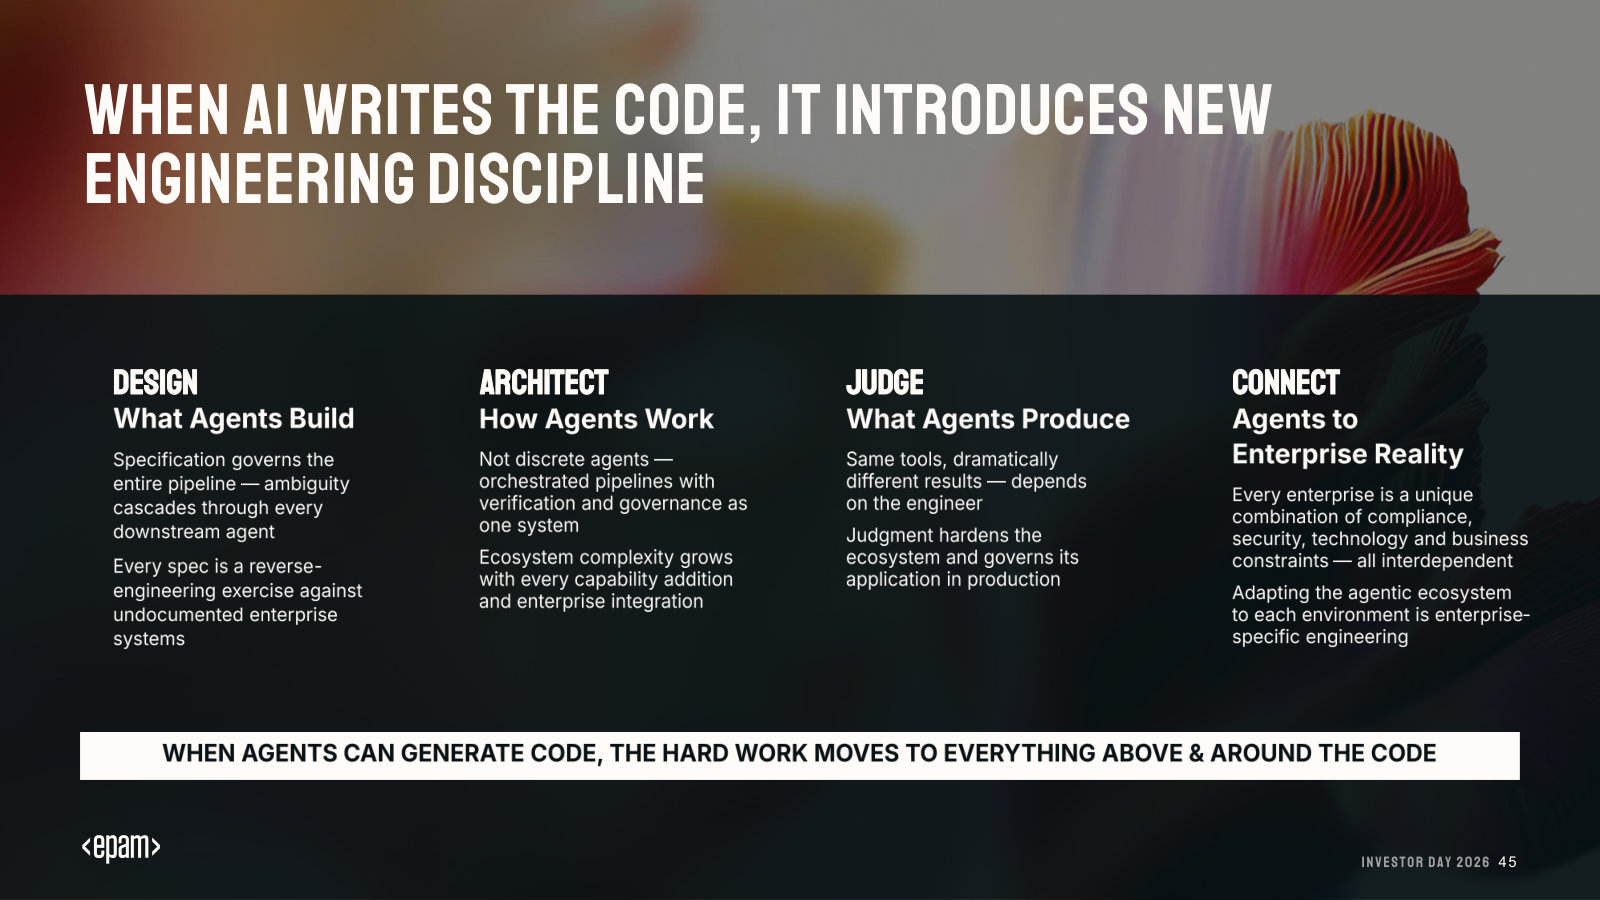
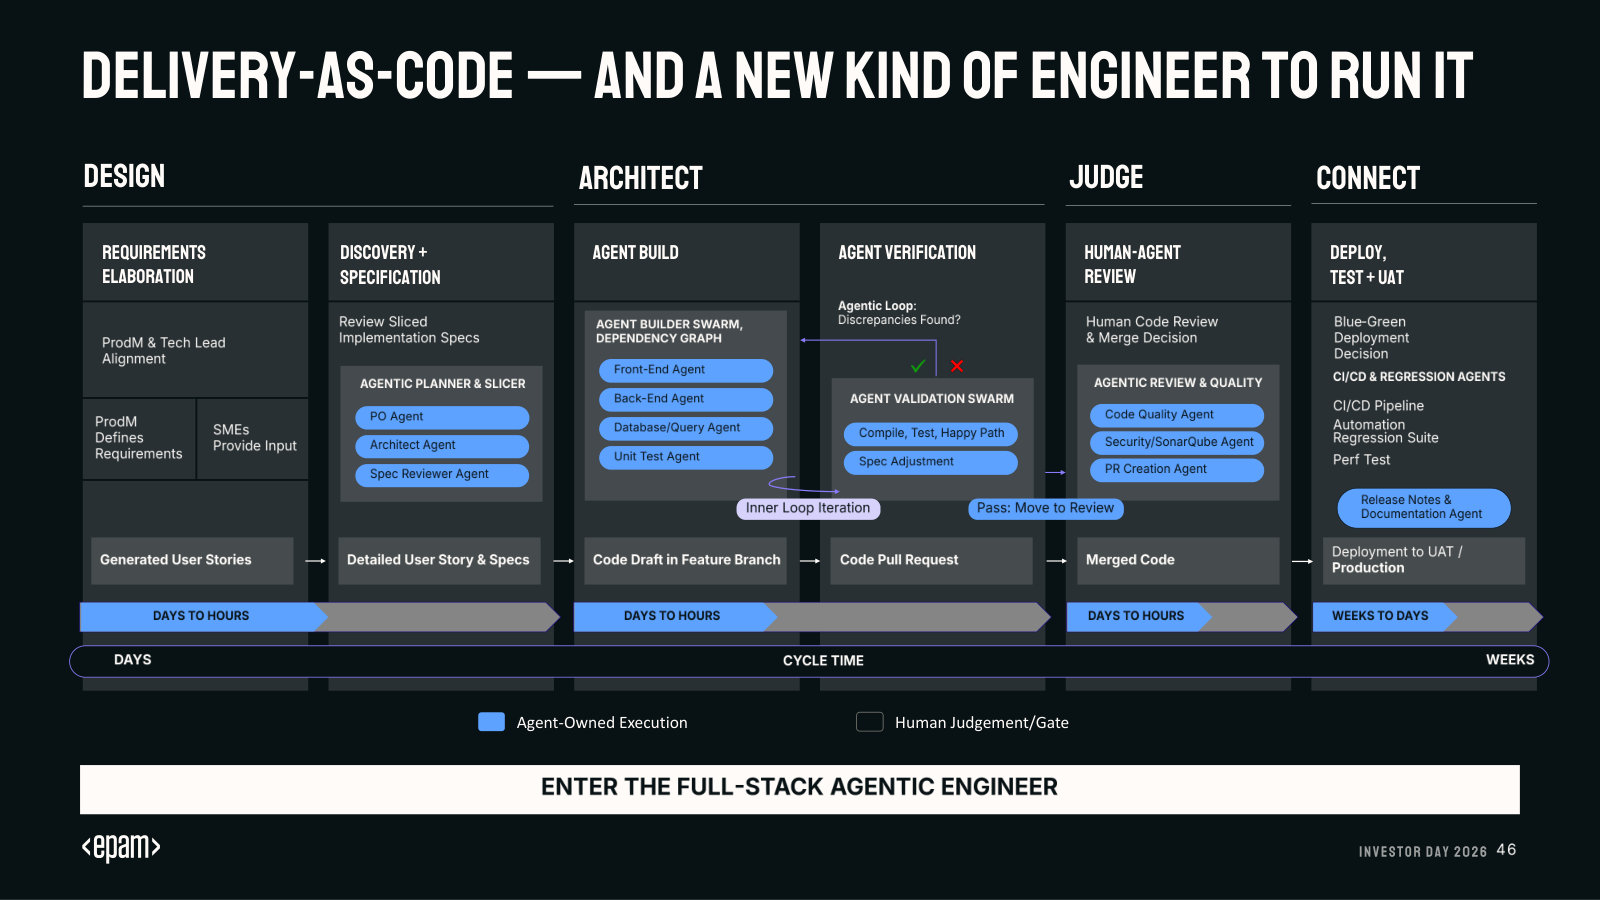
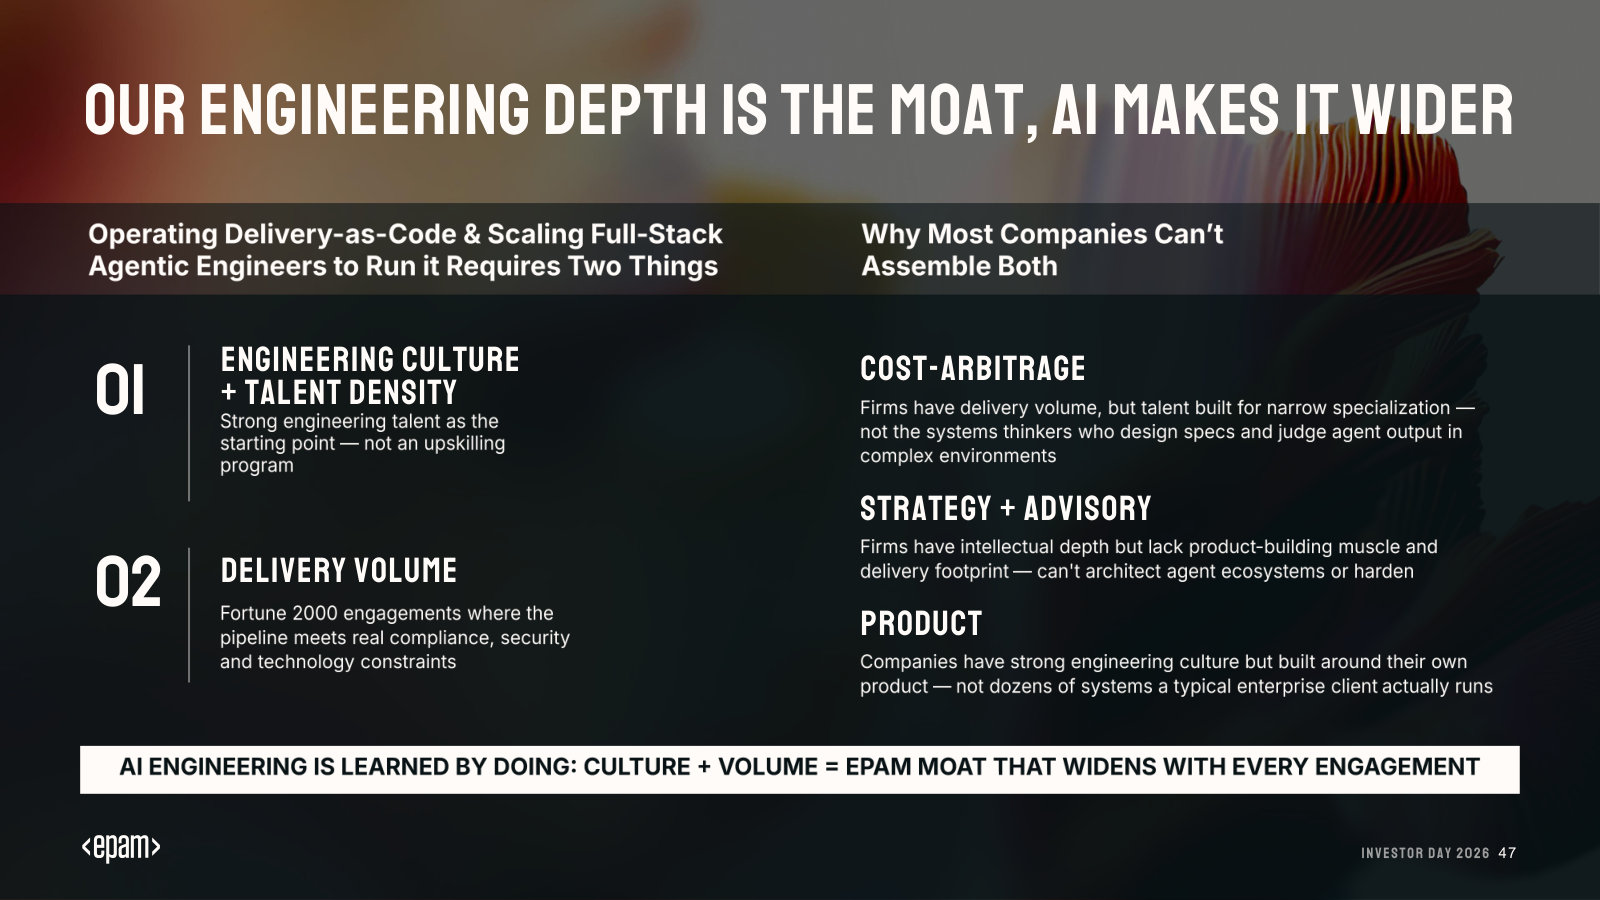
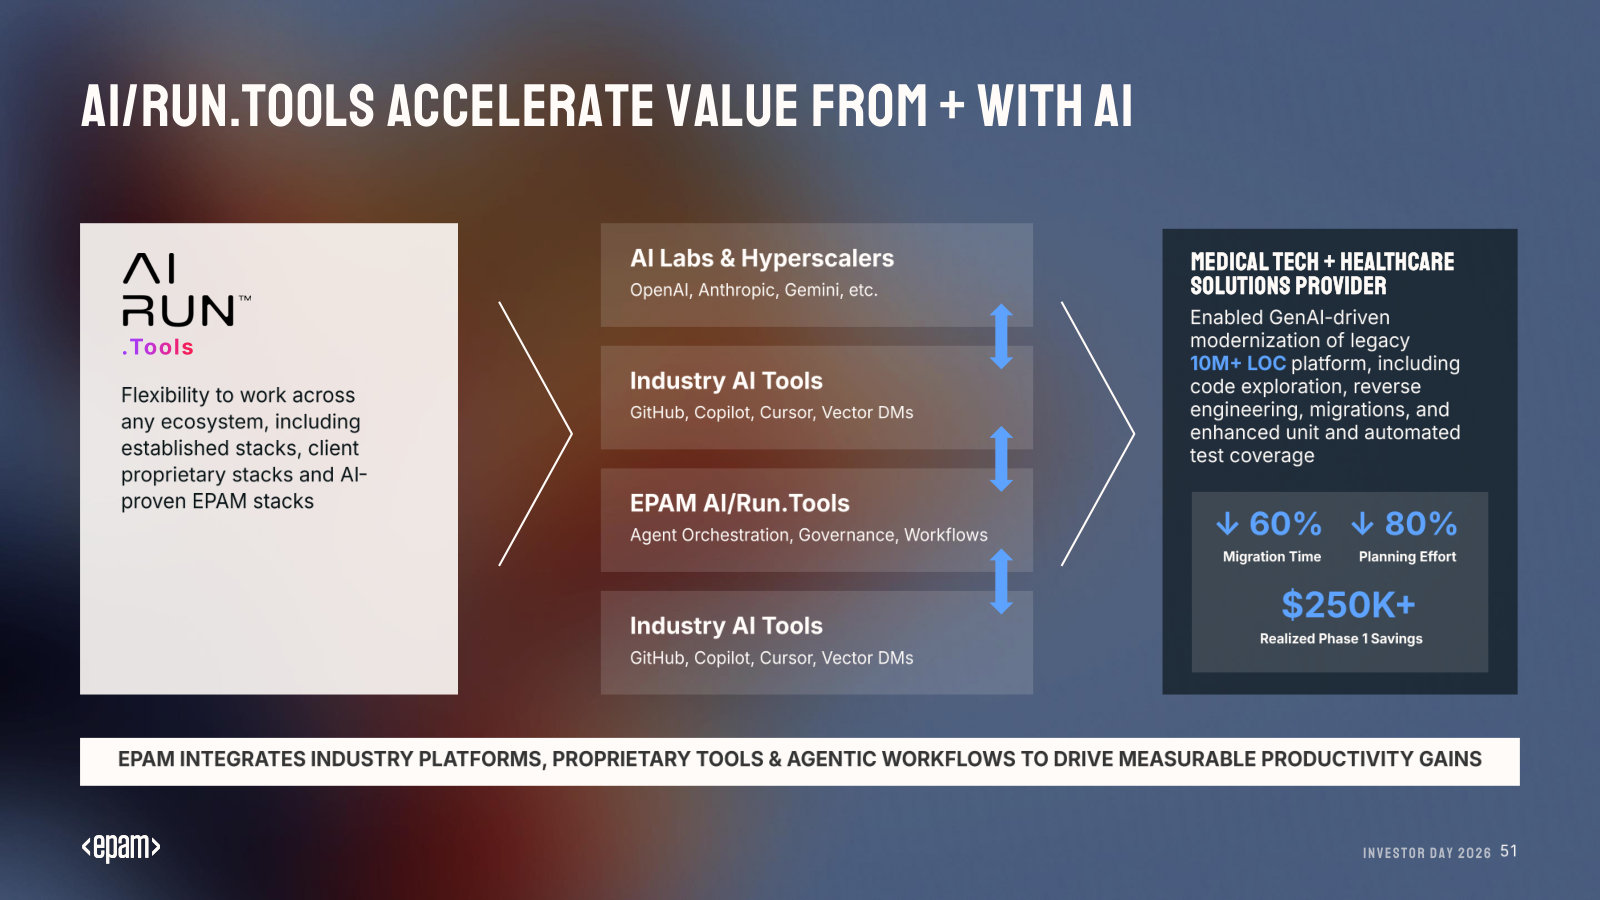
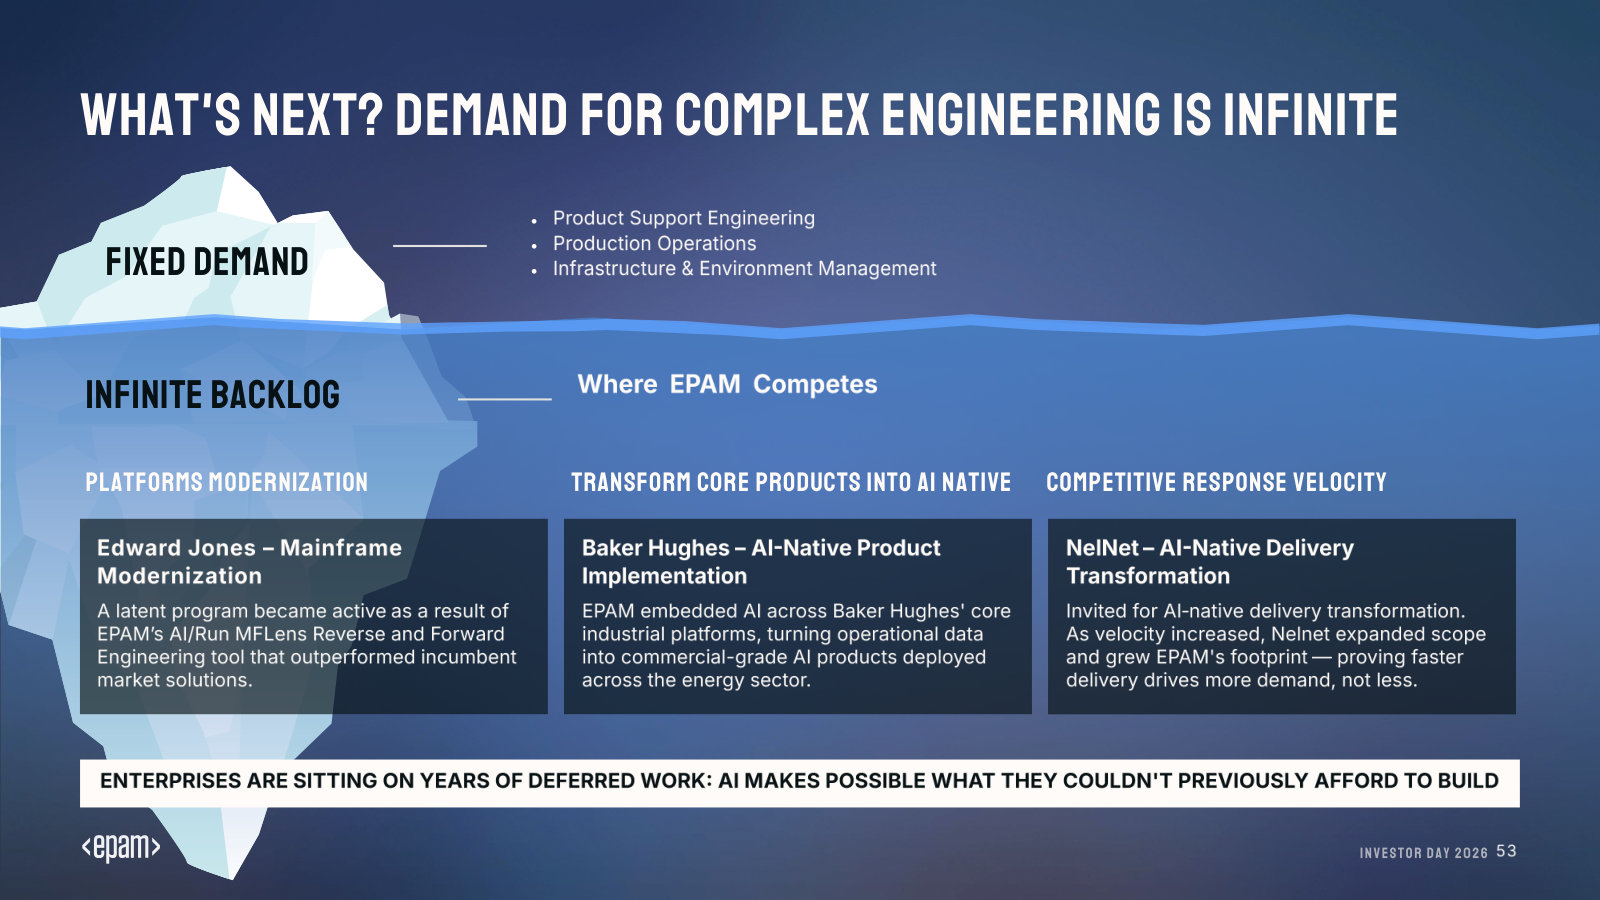
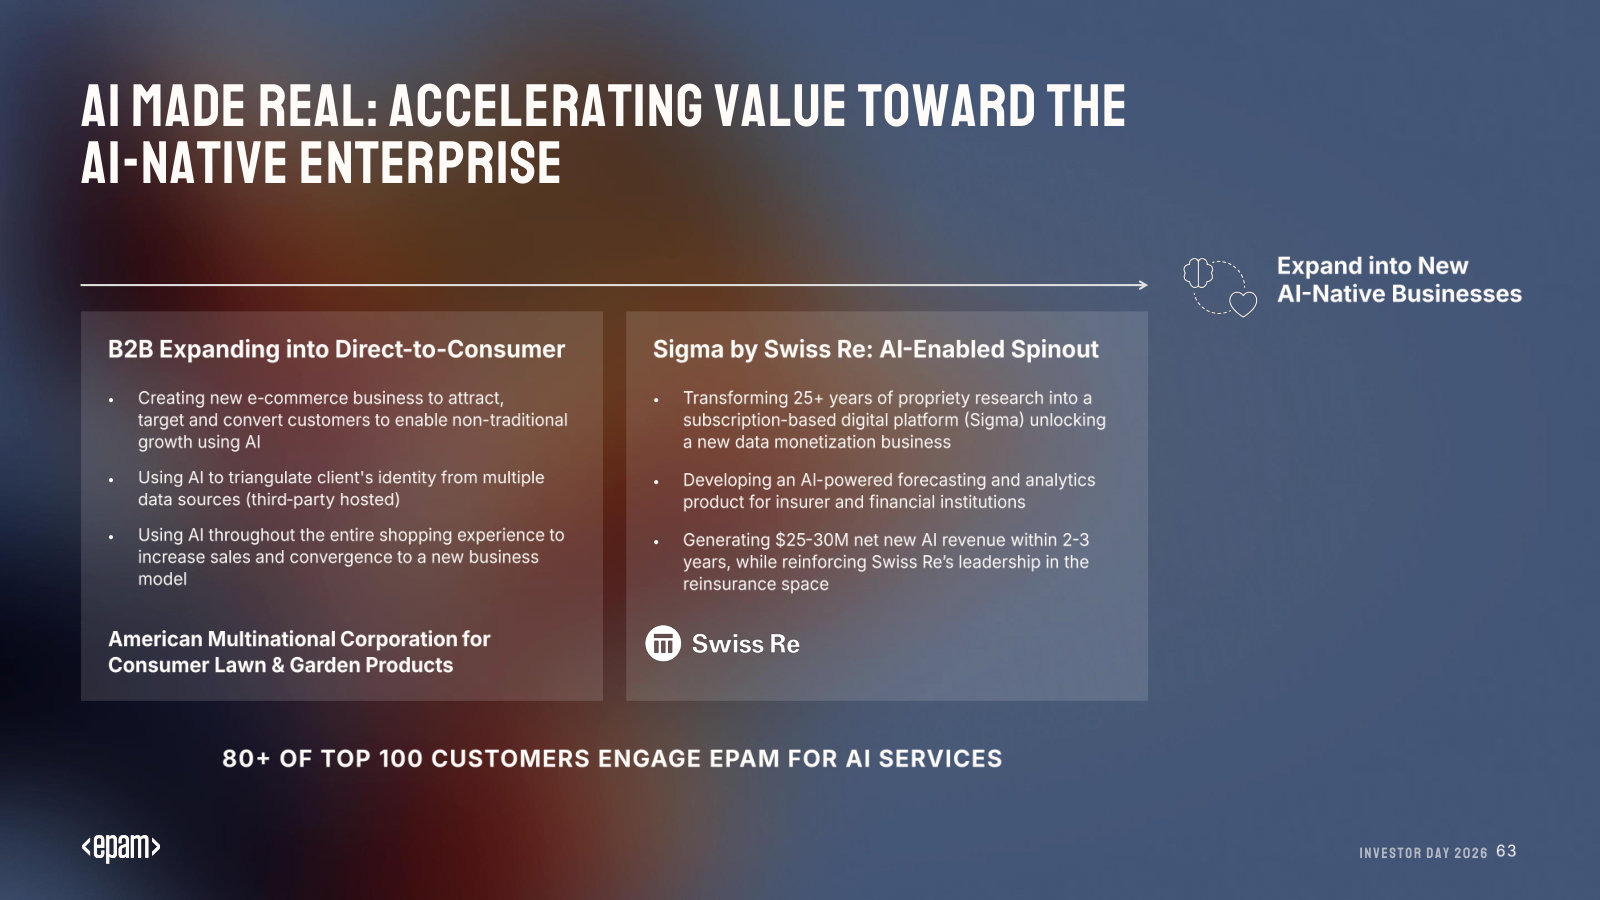
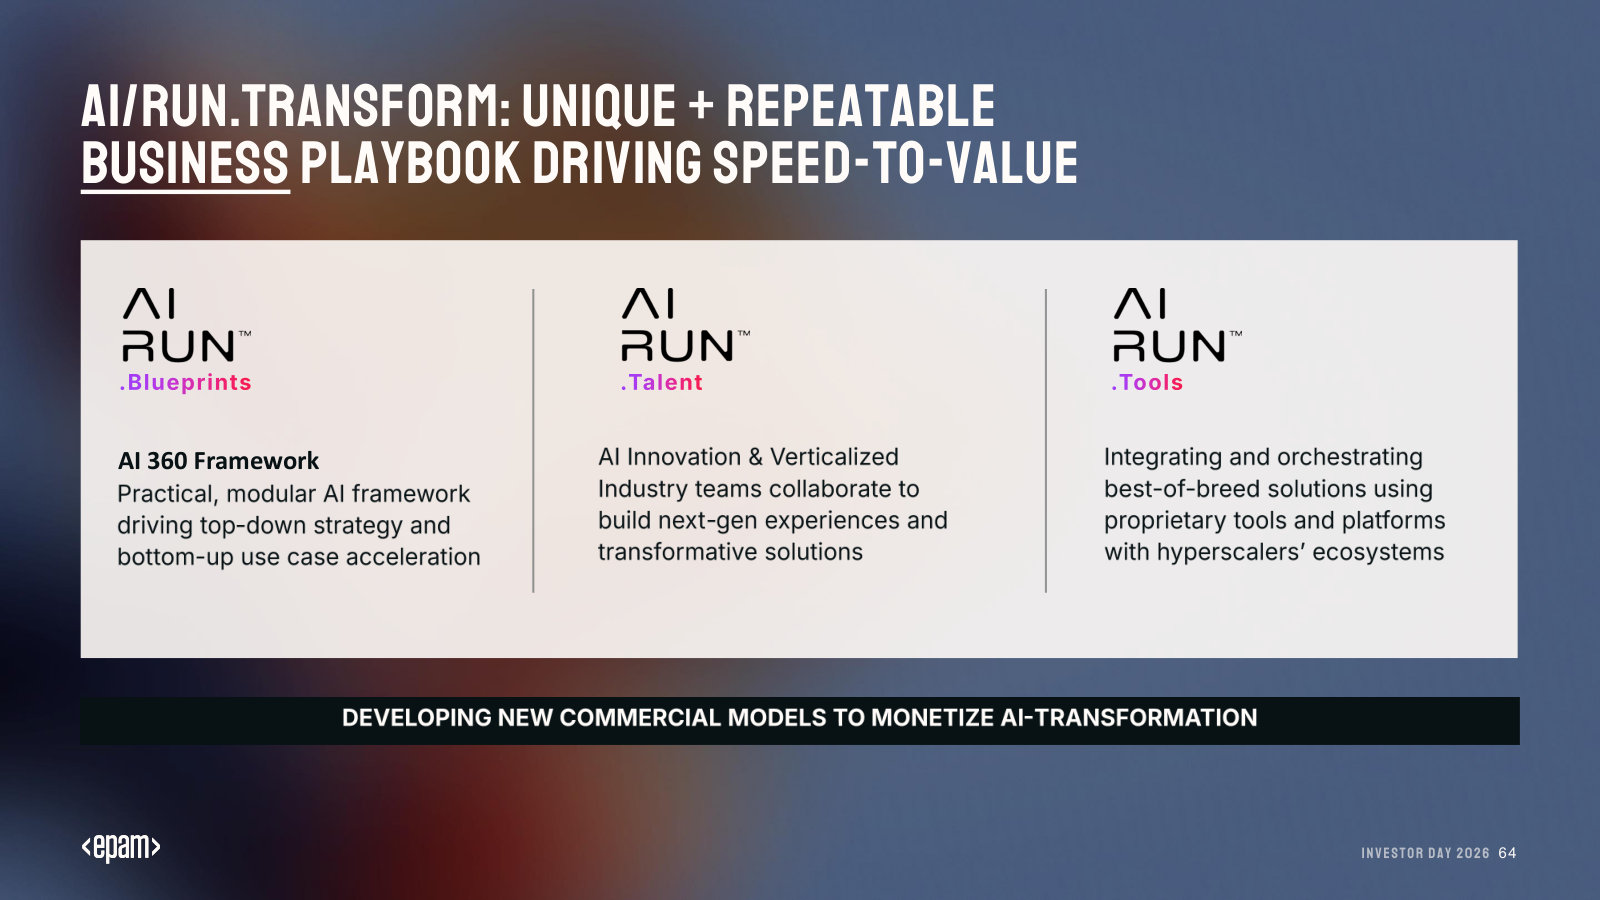
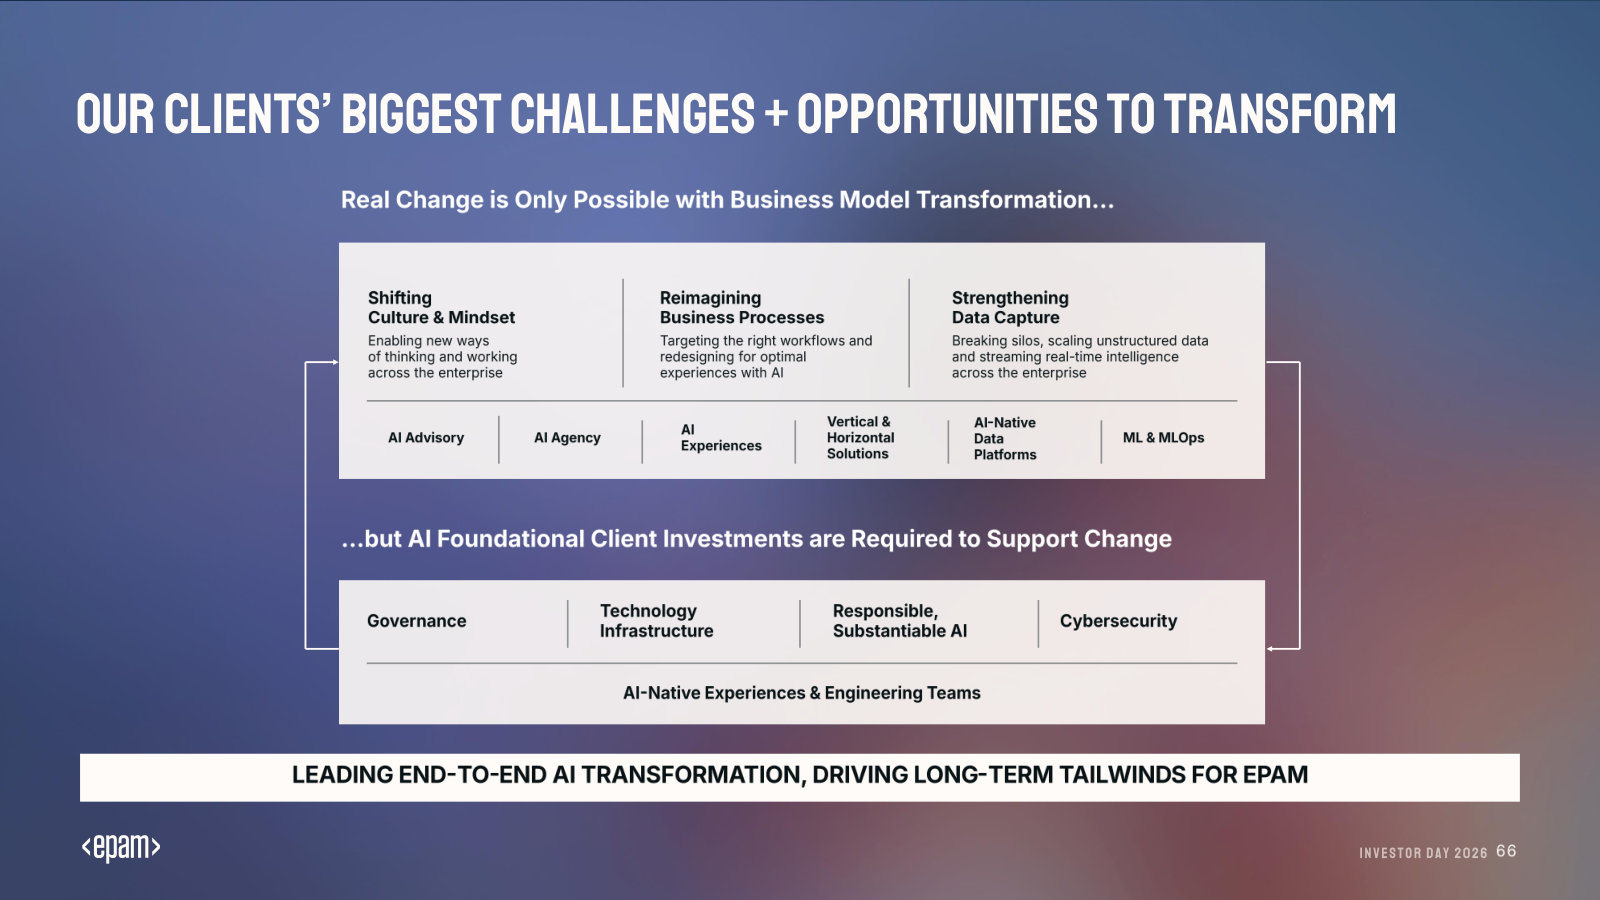
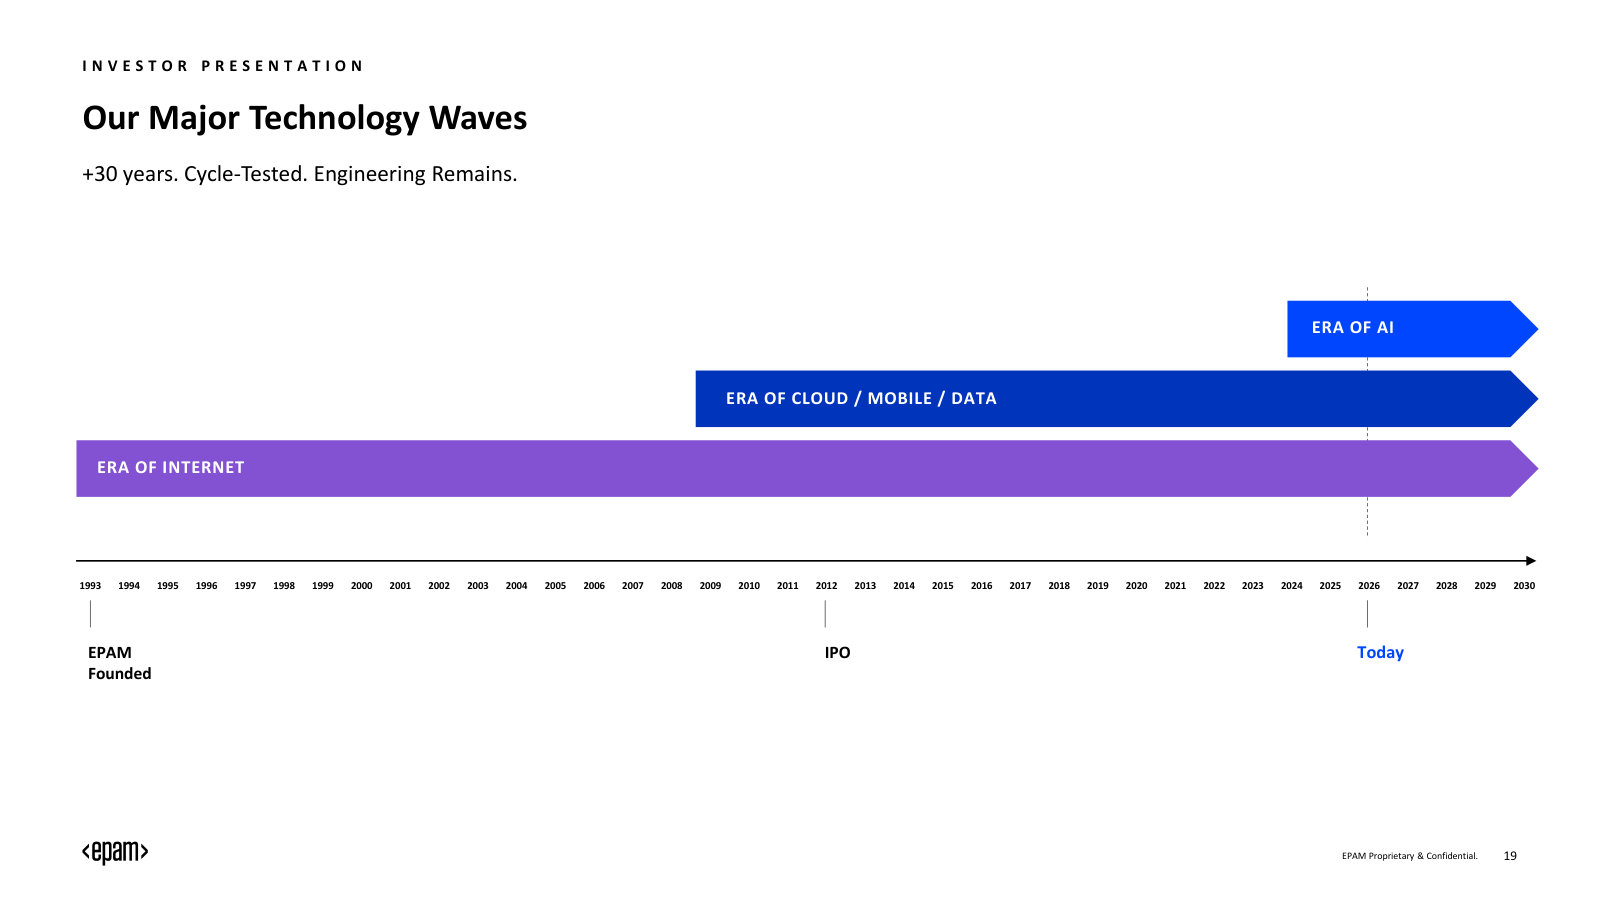
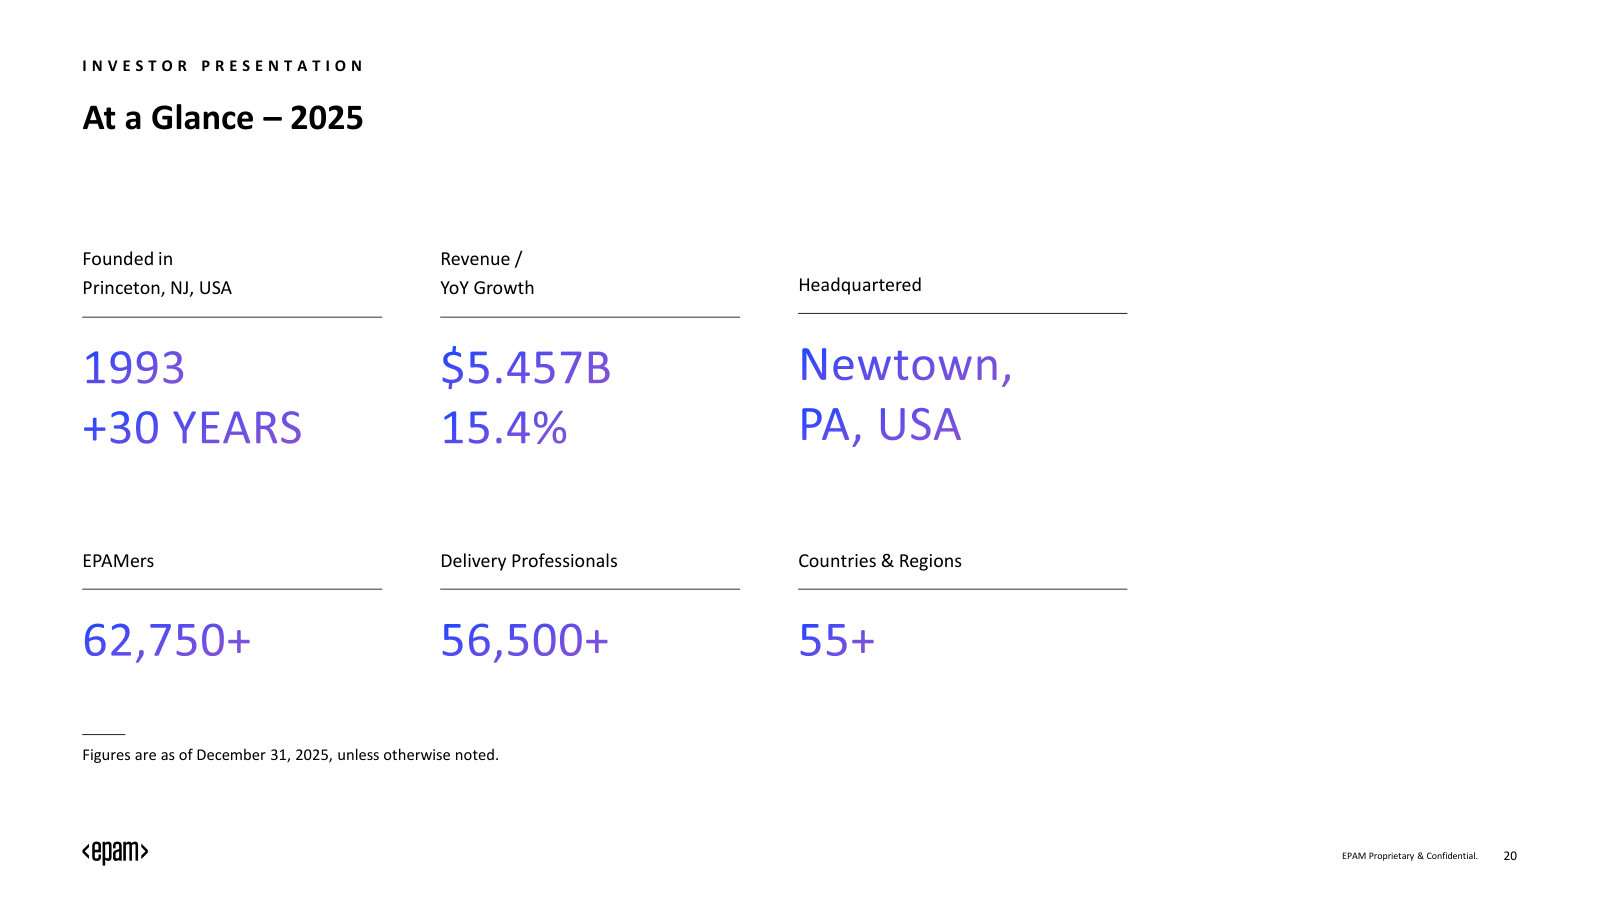
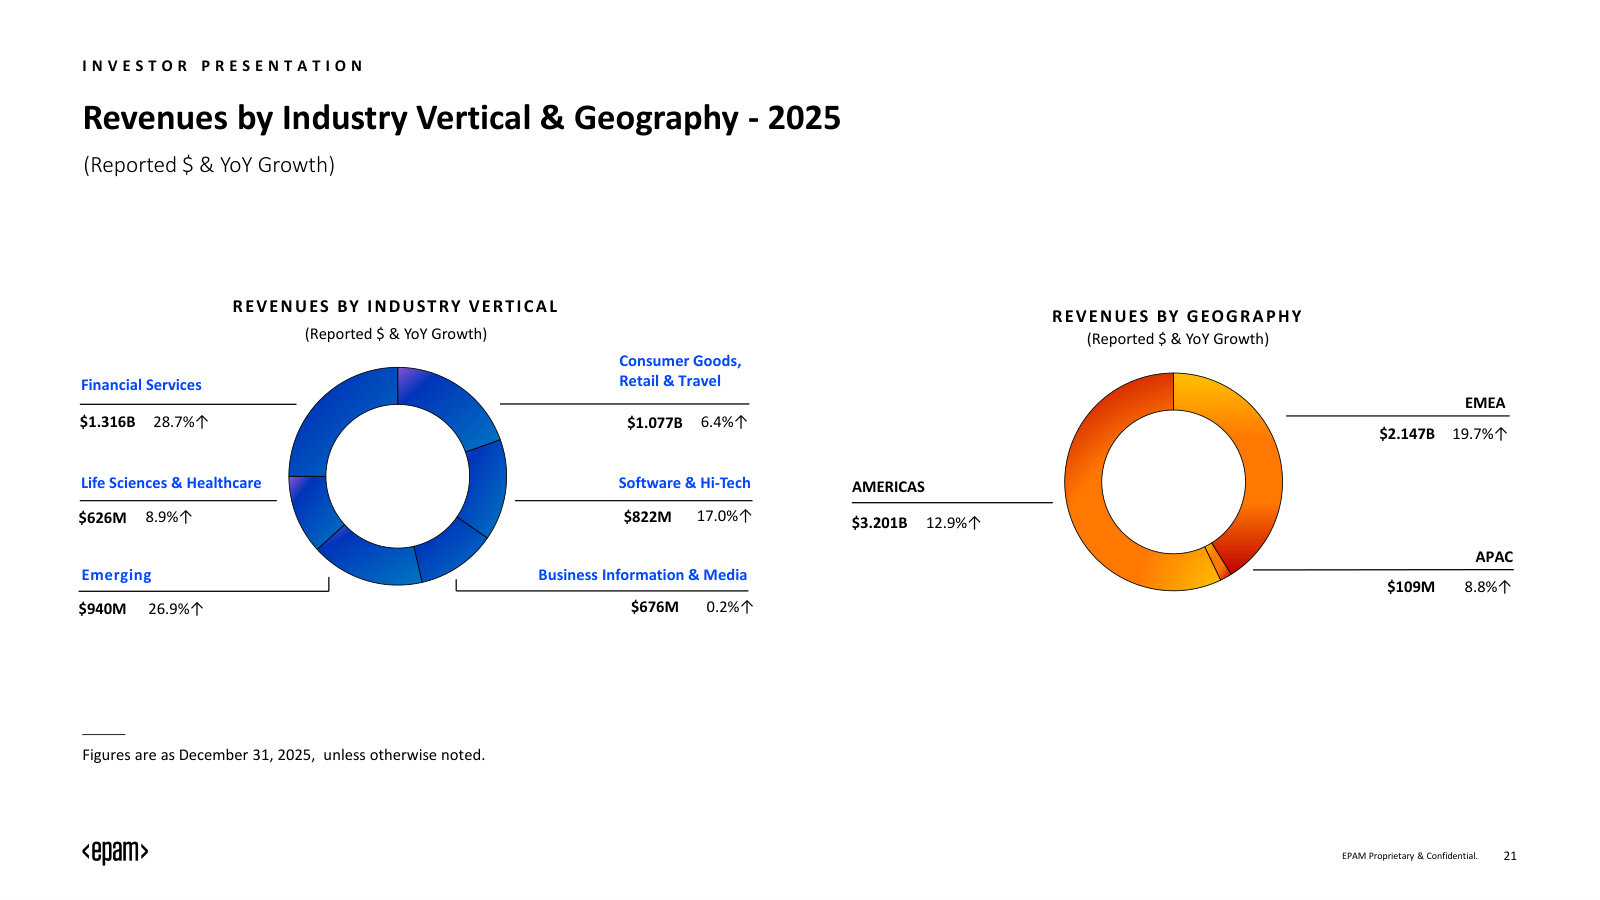
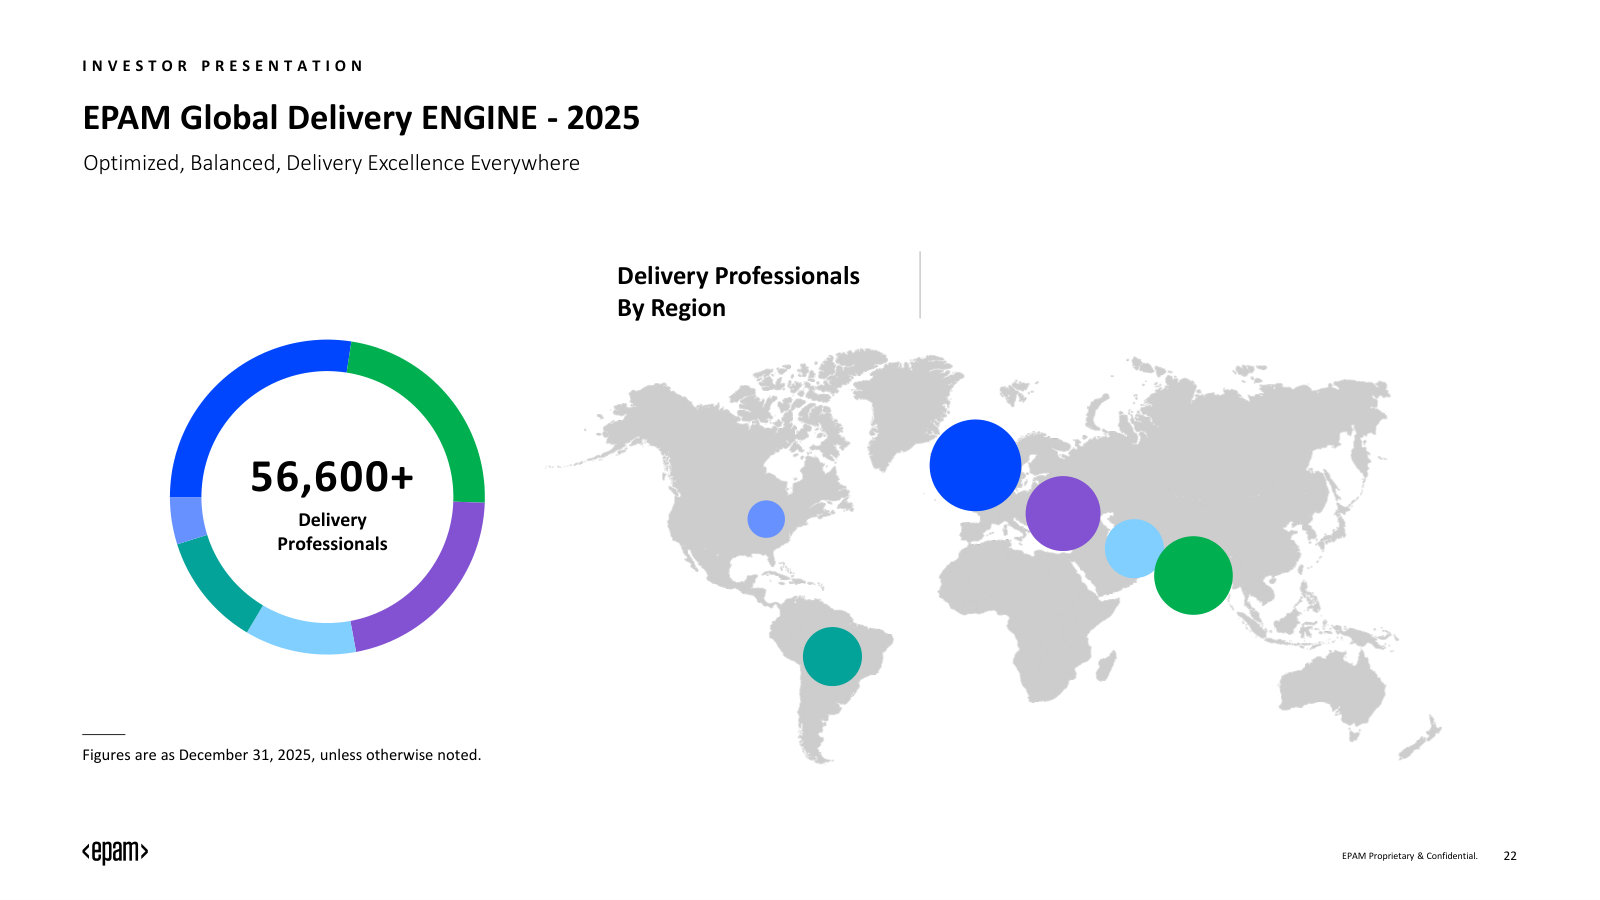
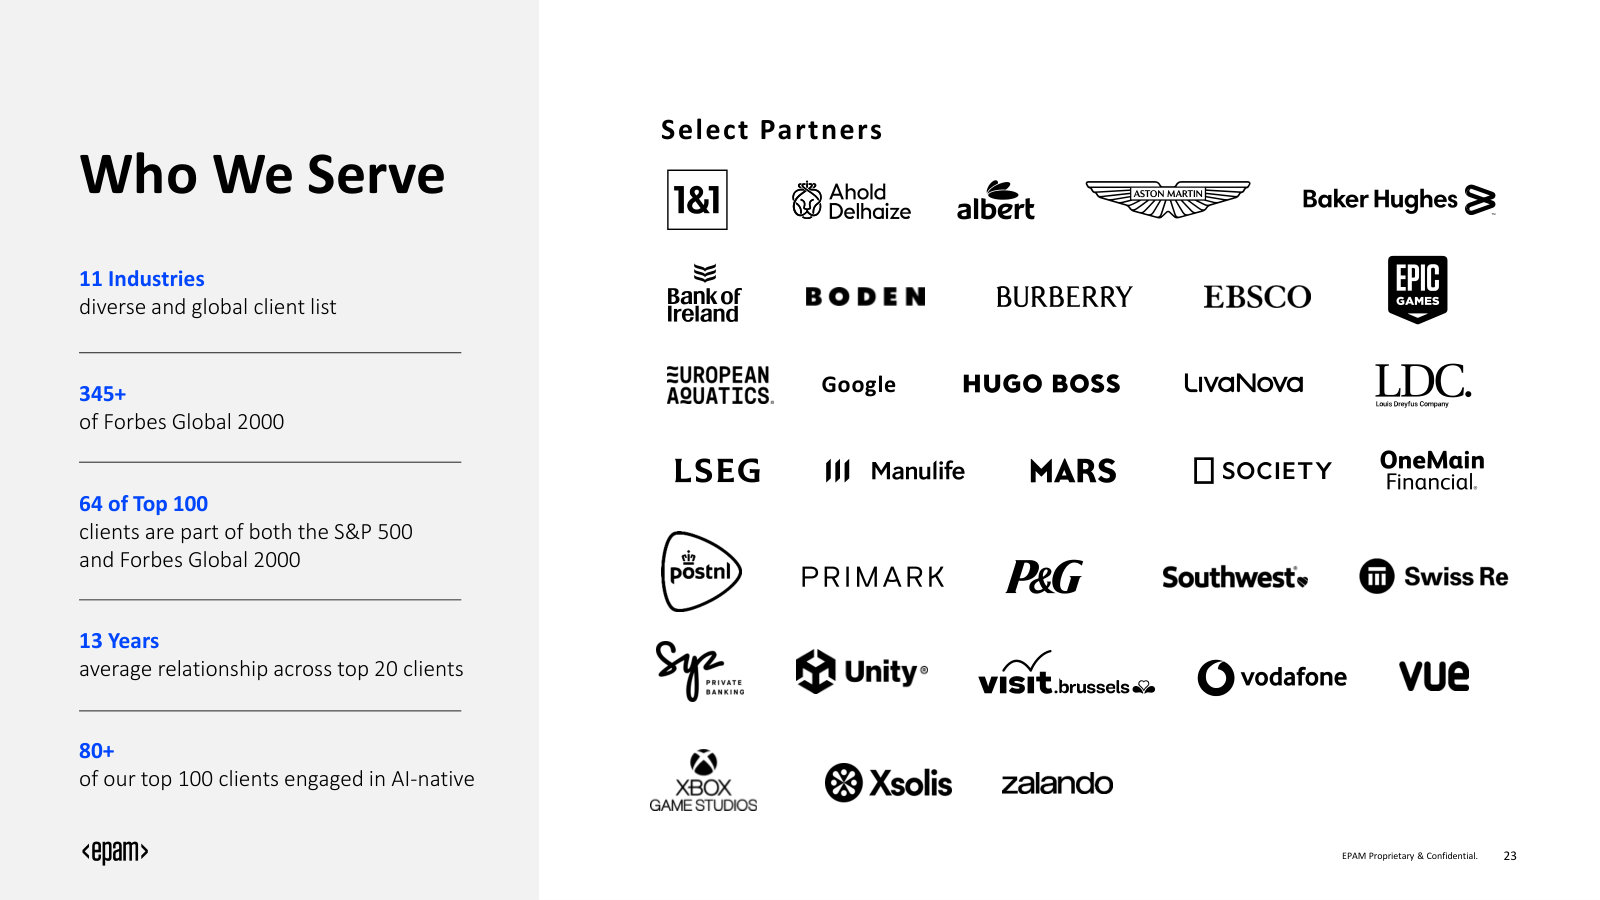
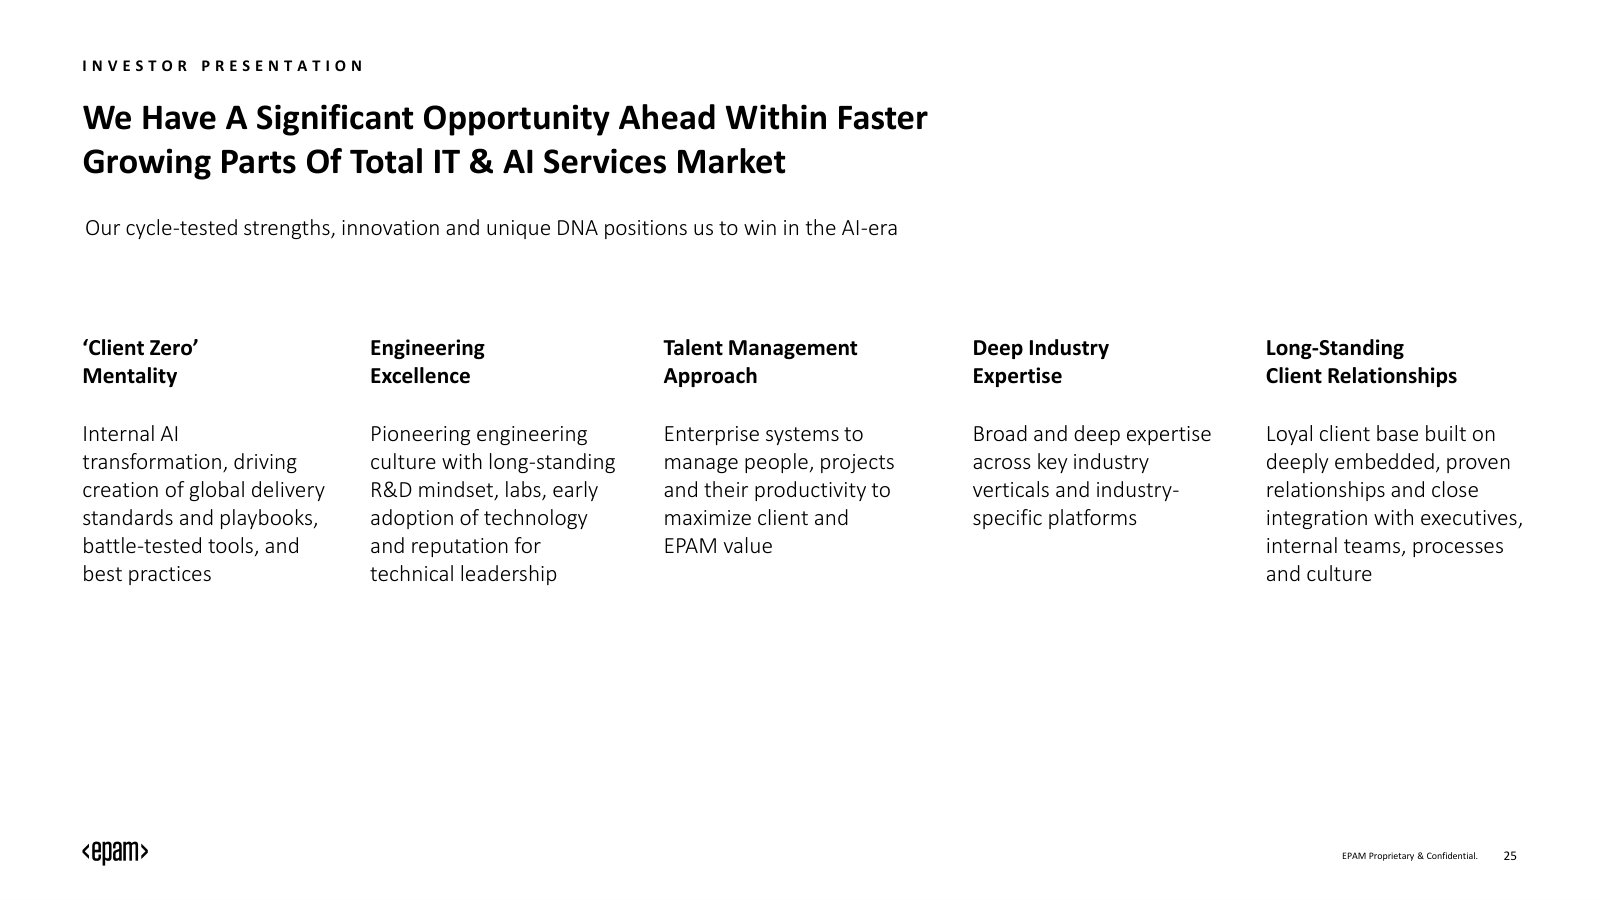
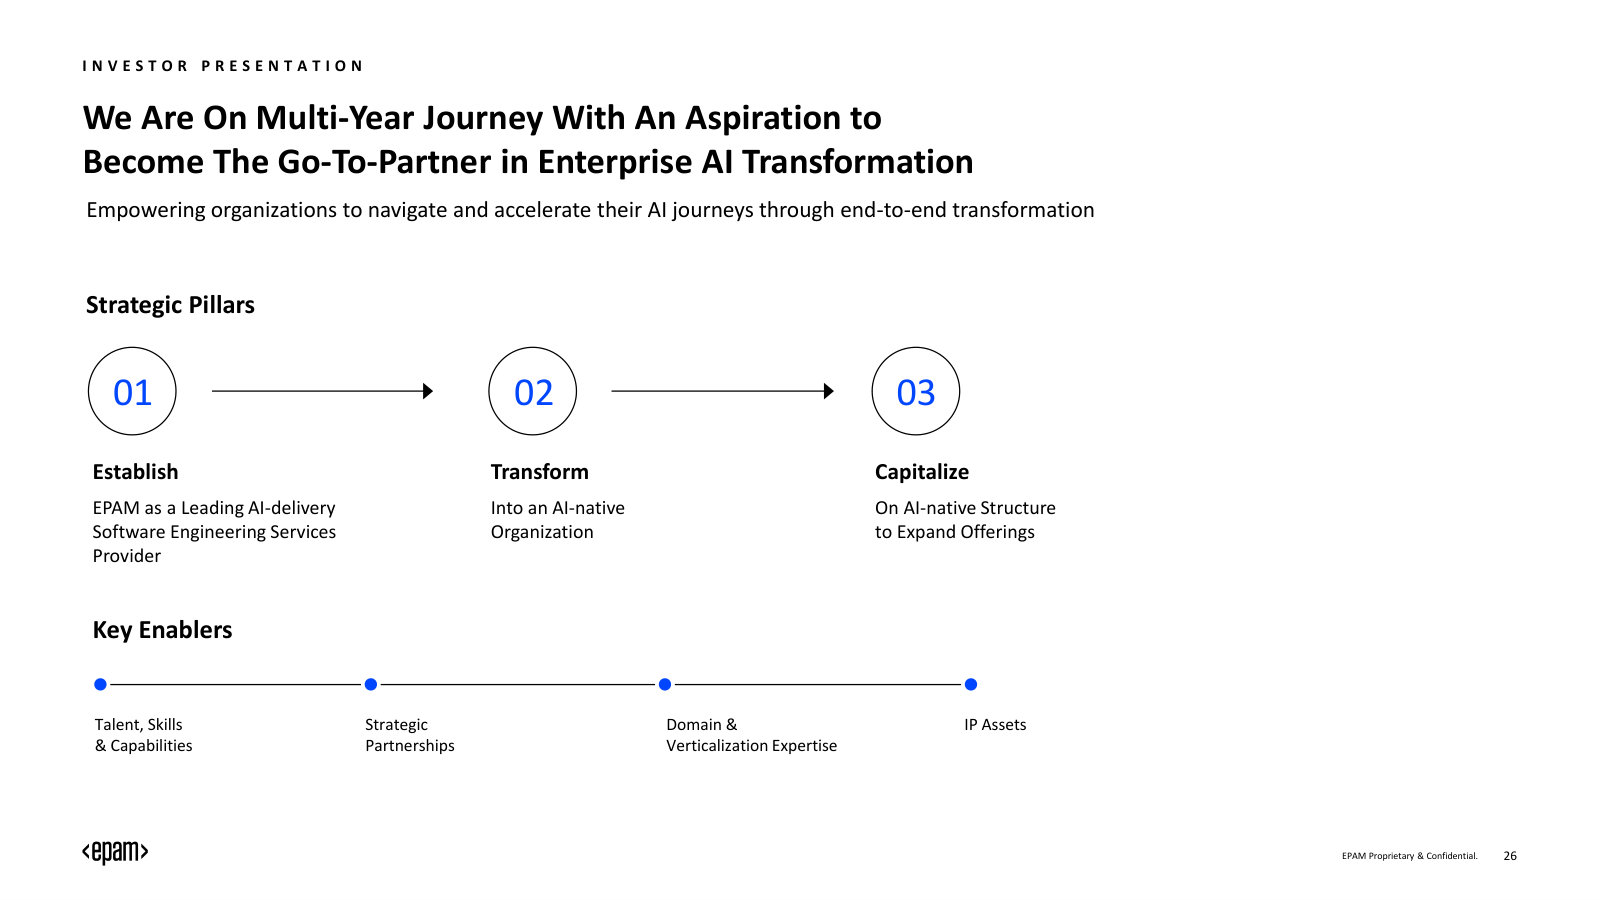
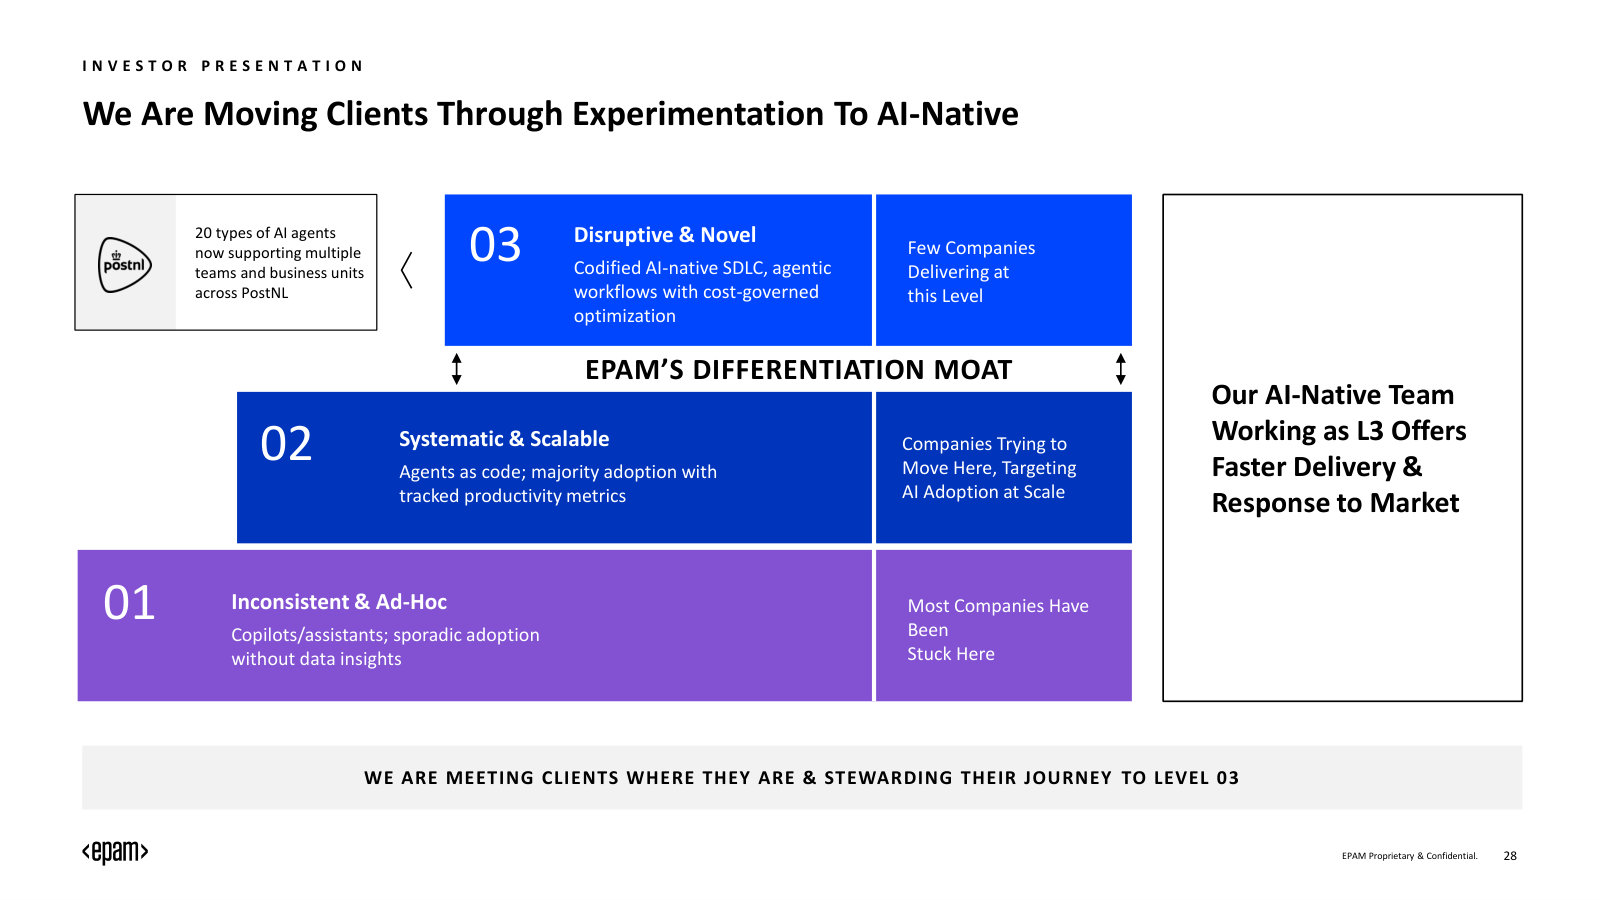
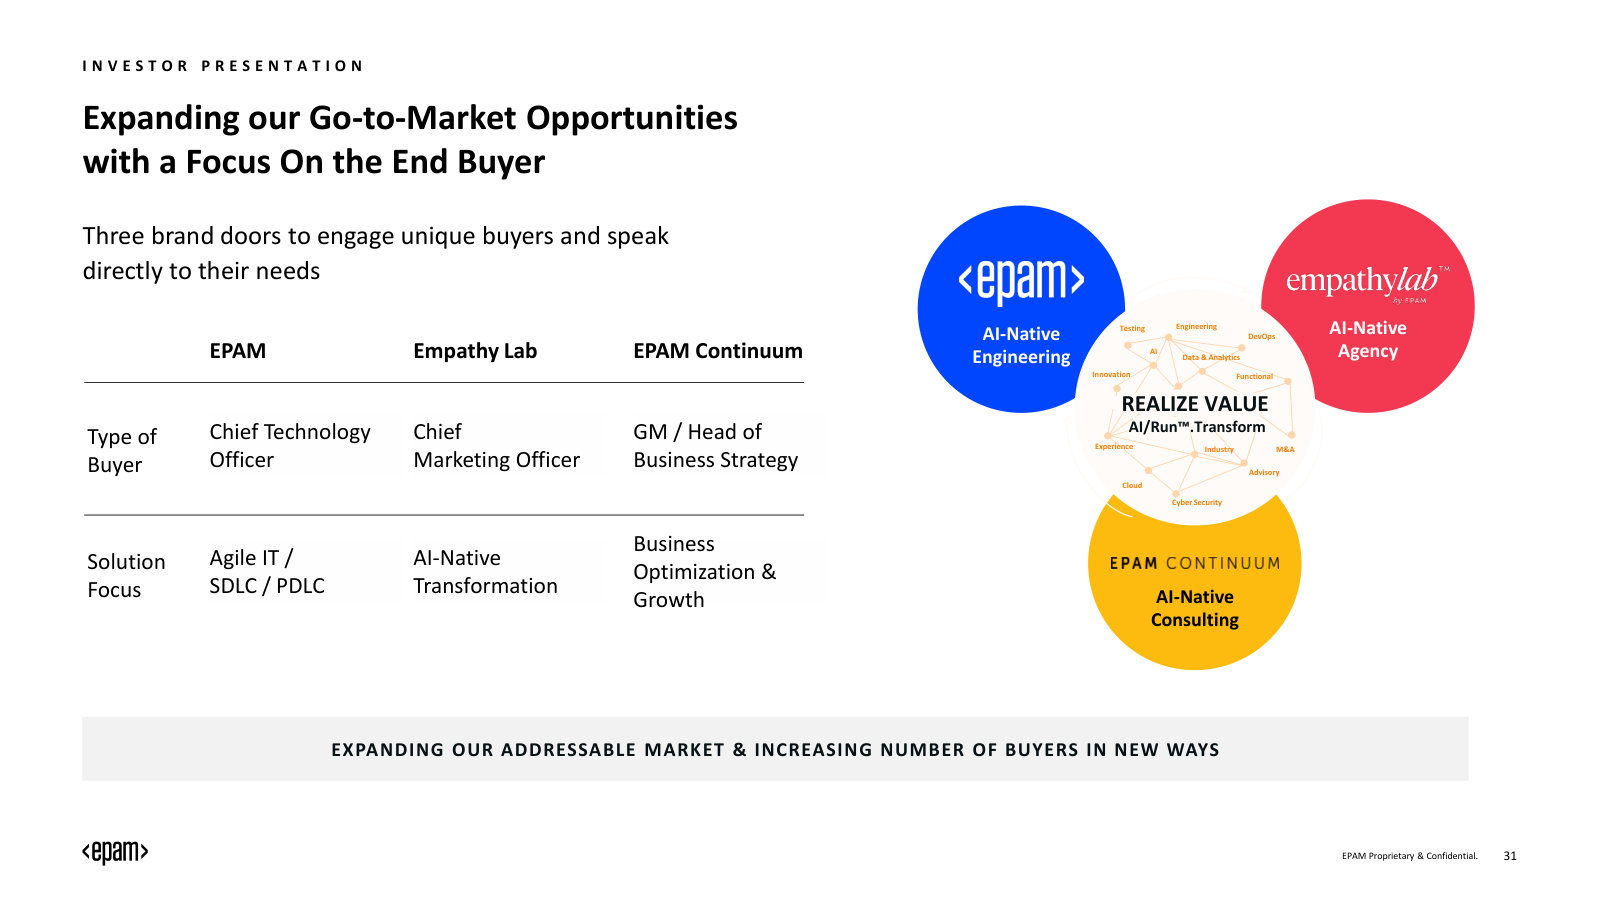
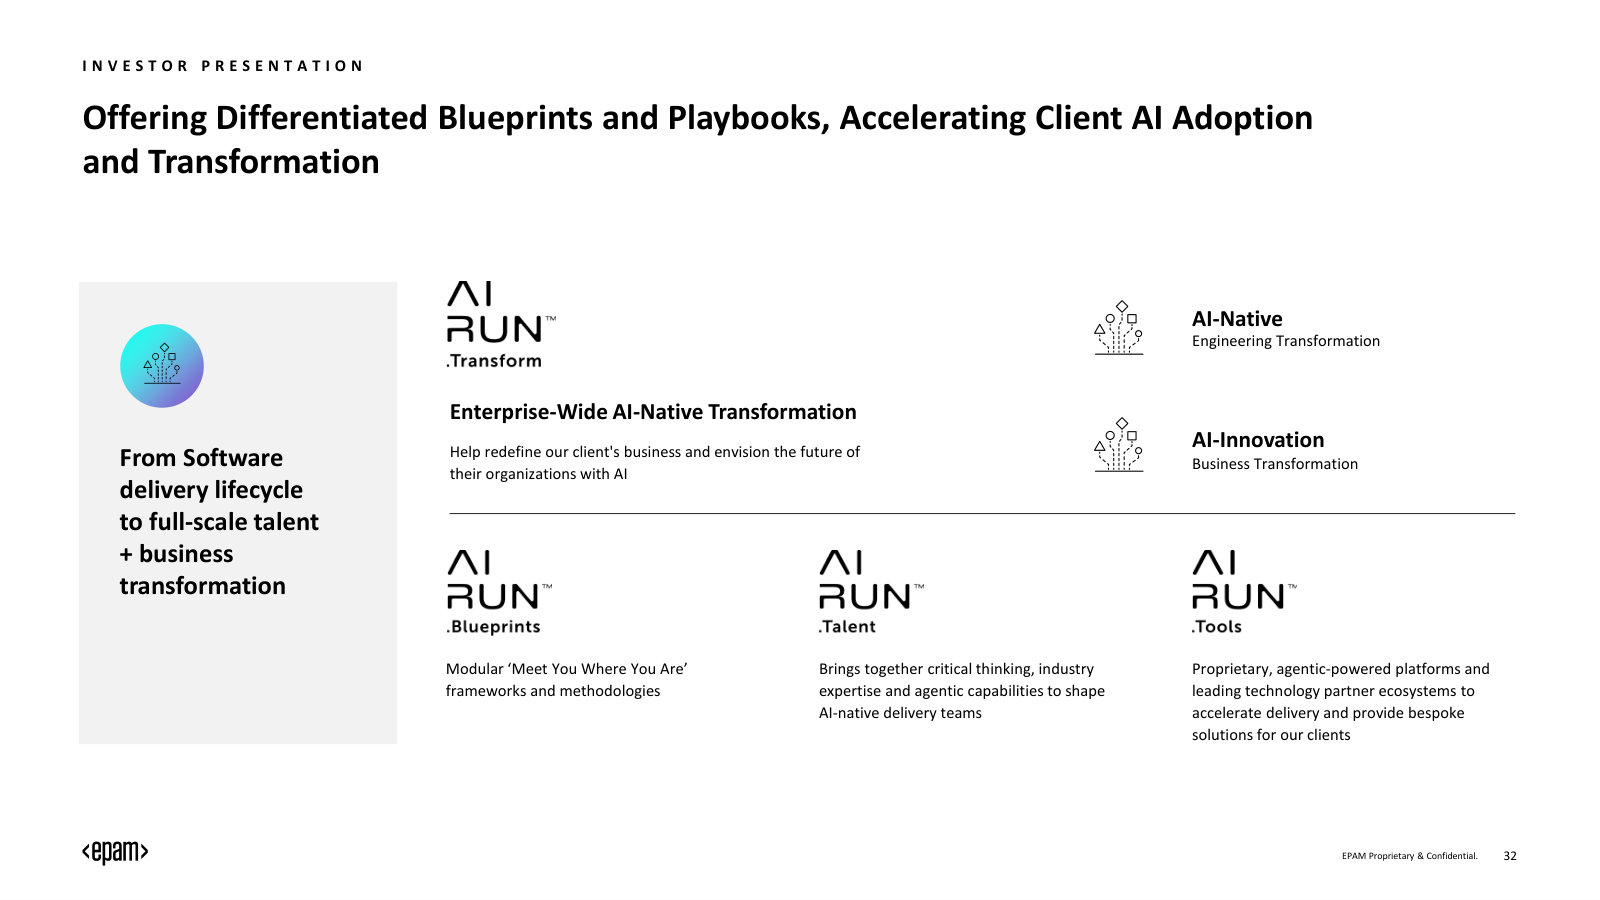
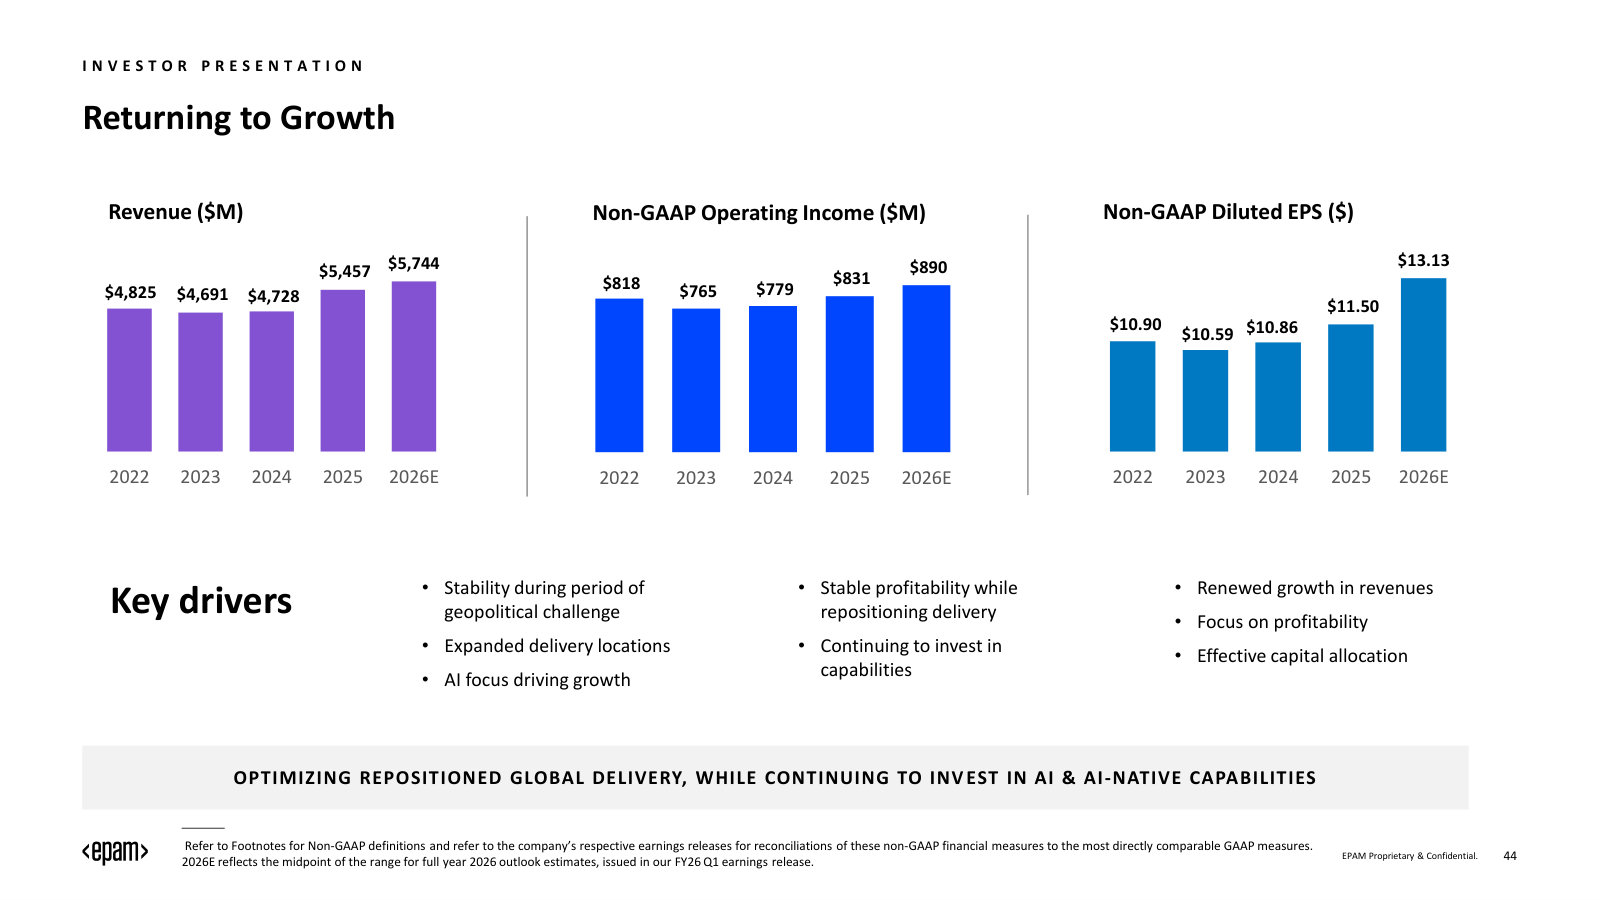
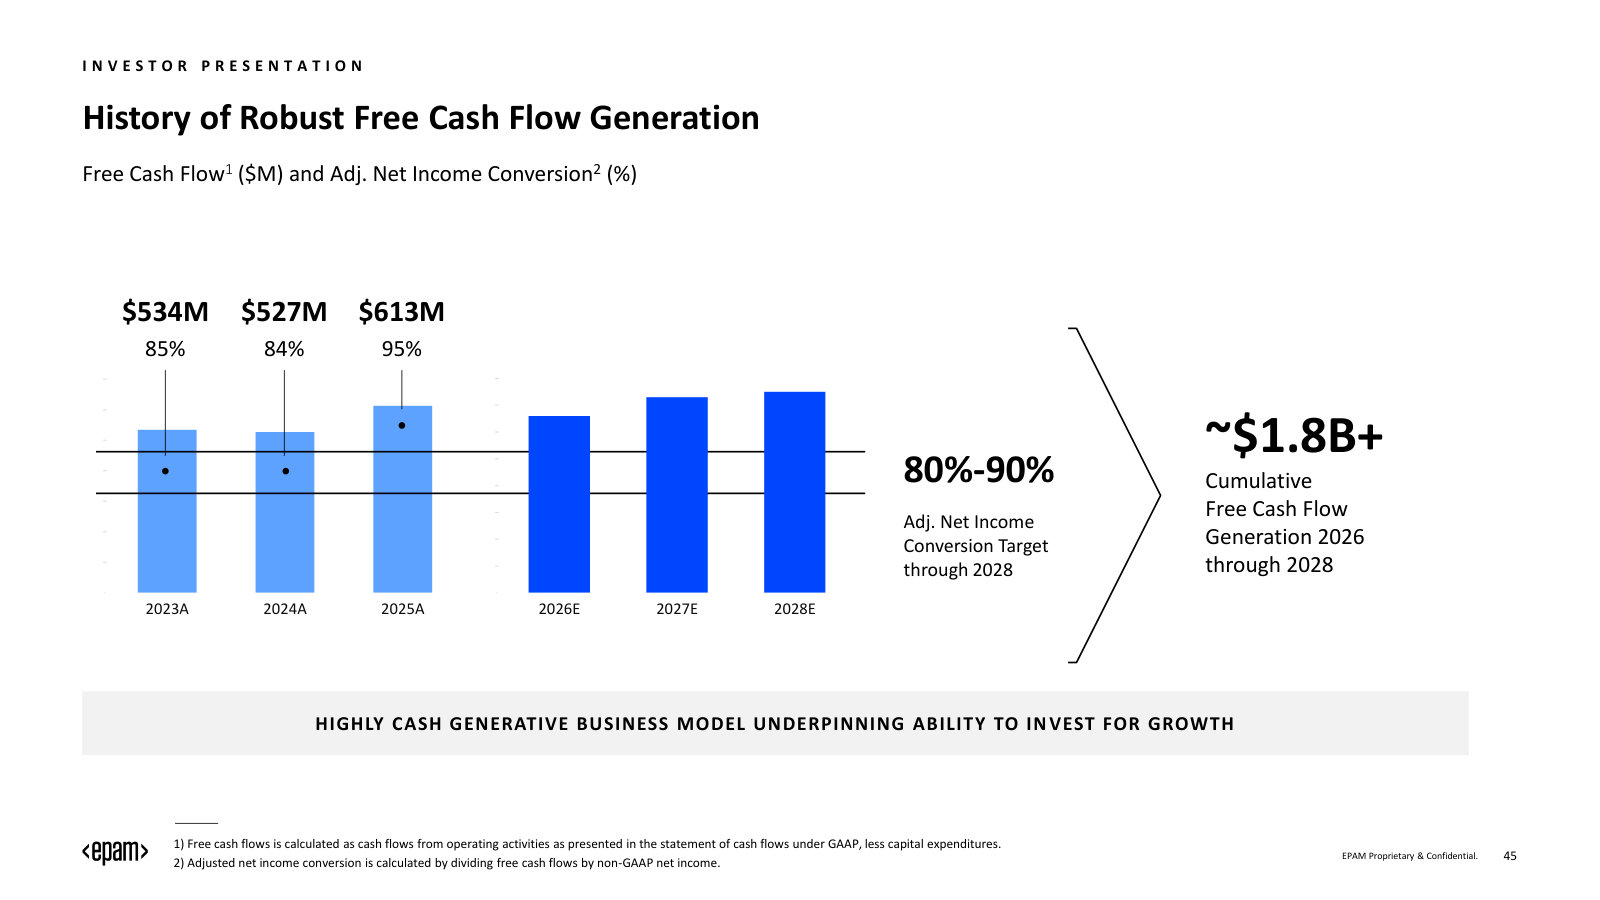
EPAM Systems, Inc.'s management explains the business in its own materials. The slides below do the most of that work, pulled from the documents preserved in Sources. Each source link opens the complete presentation at that slide in a new tab.
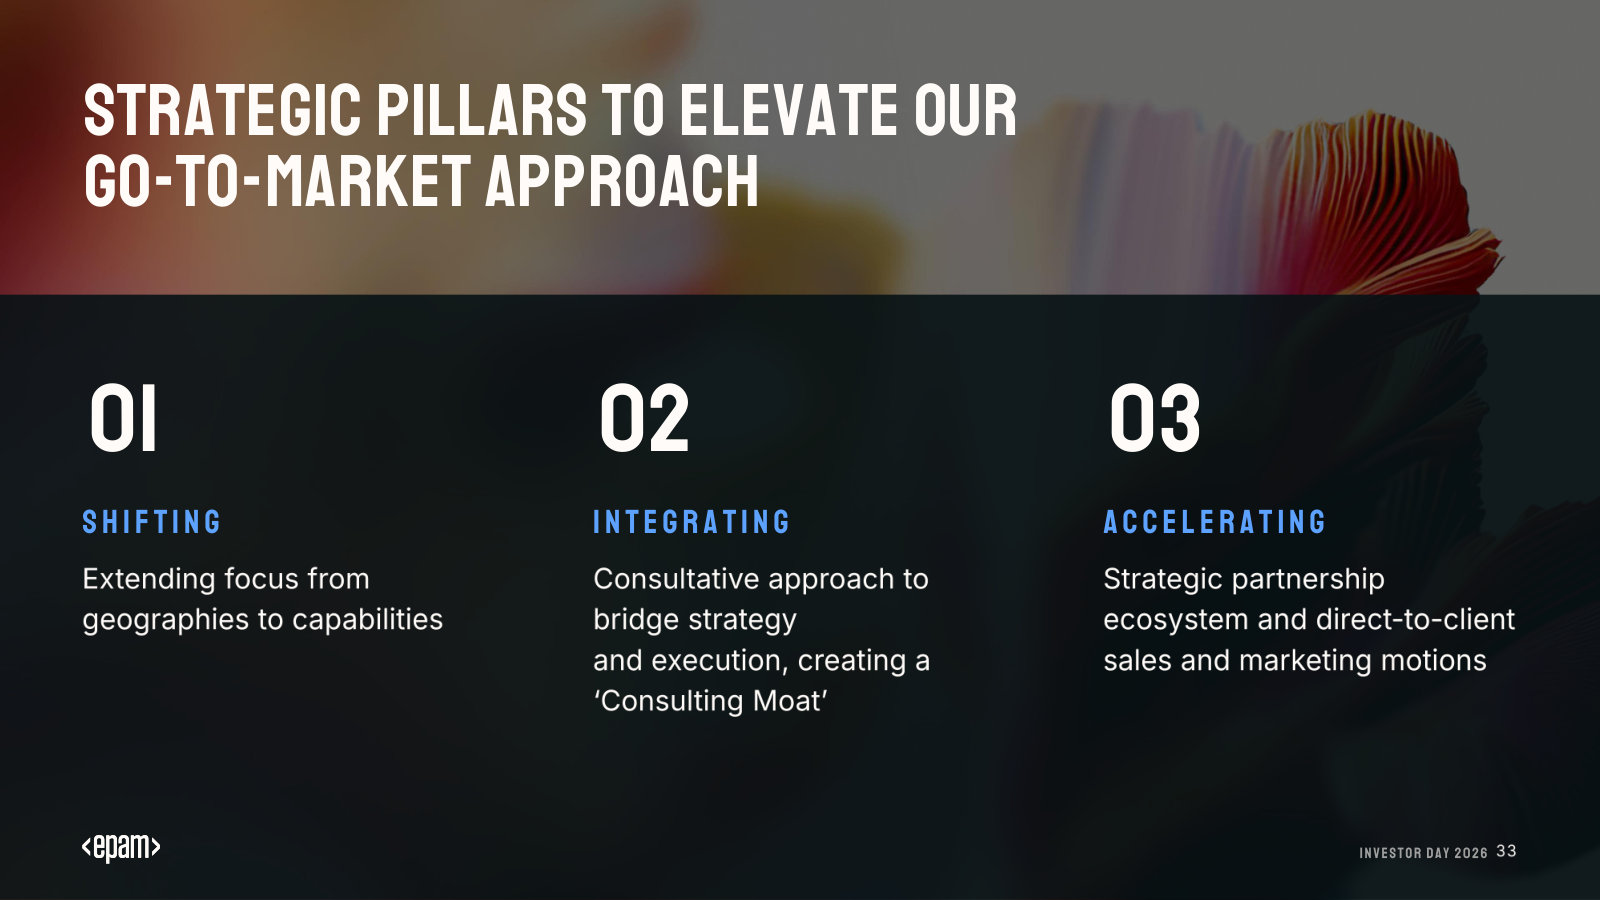
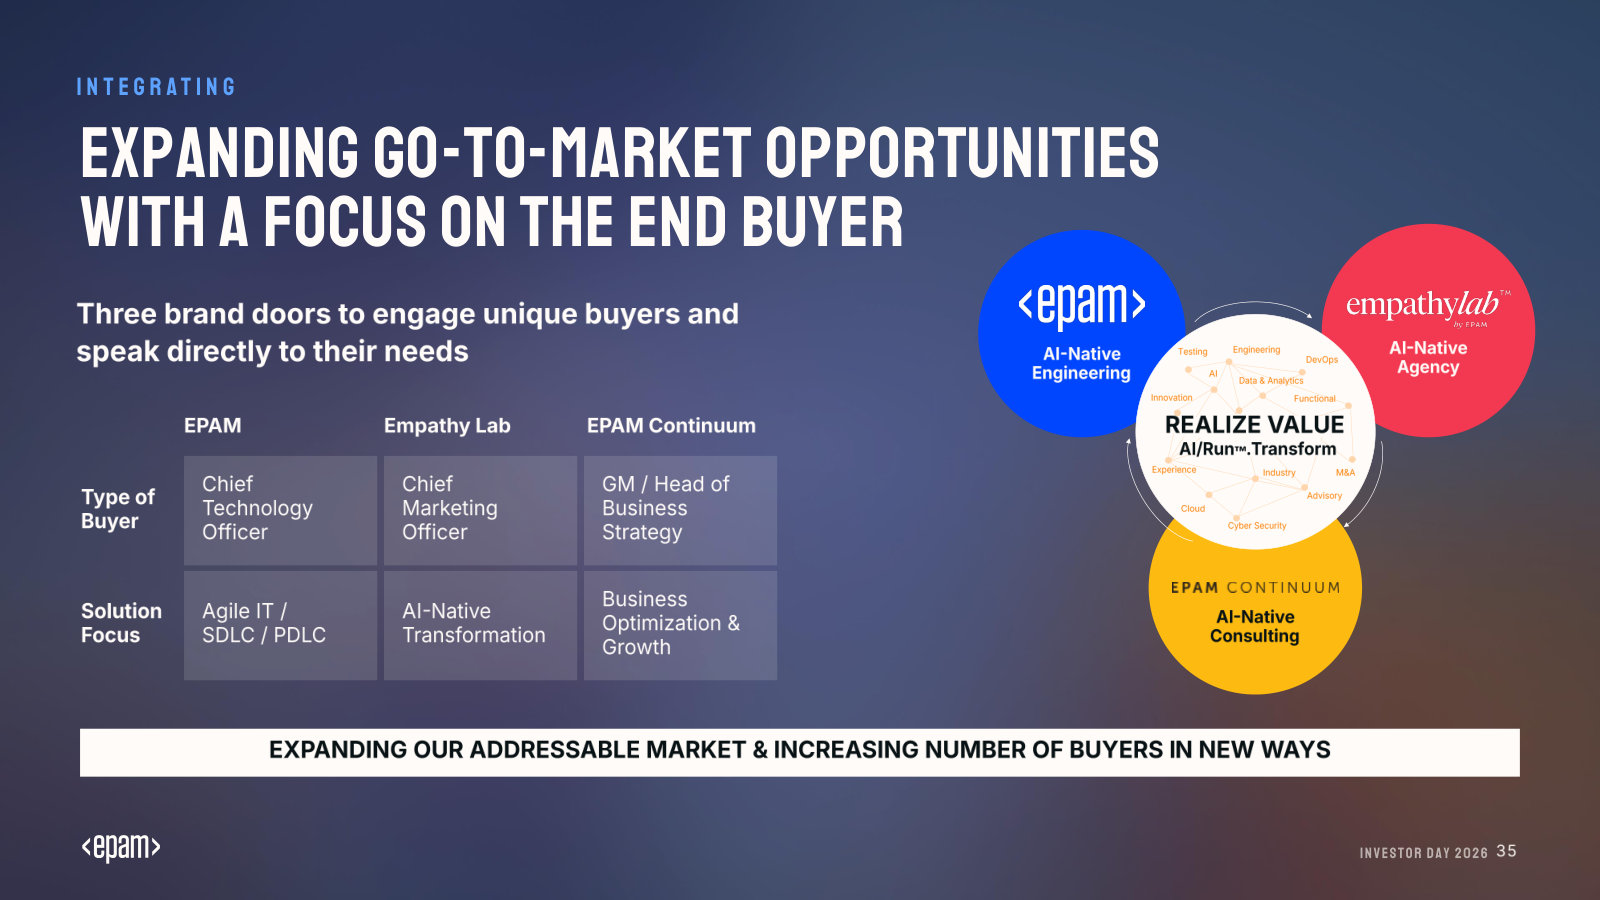
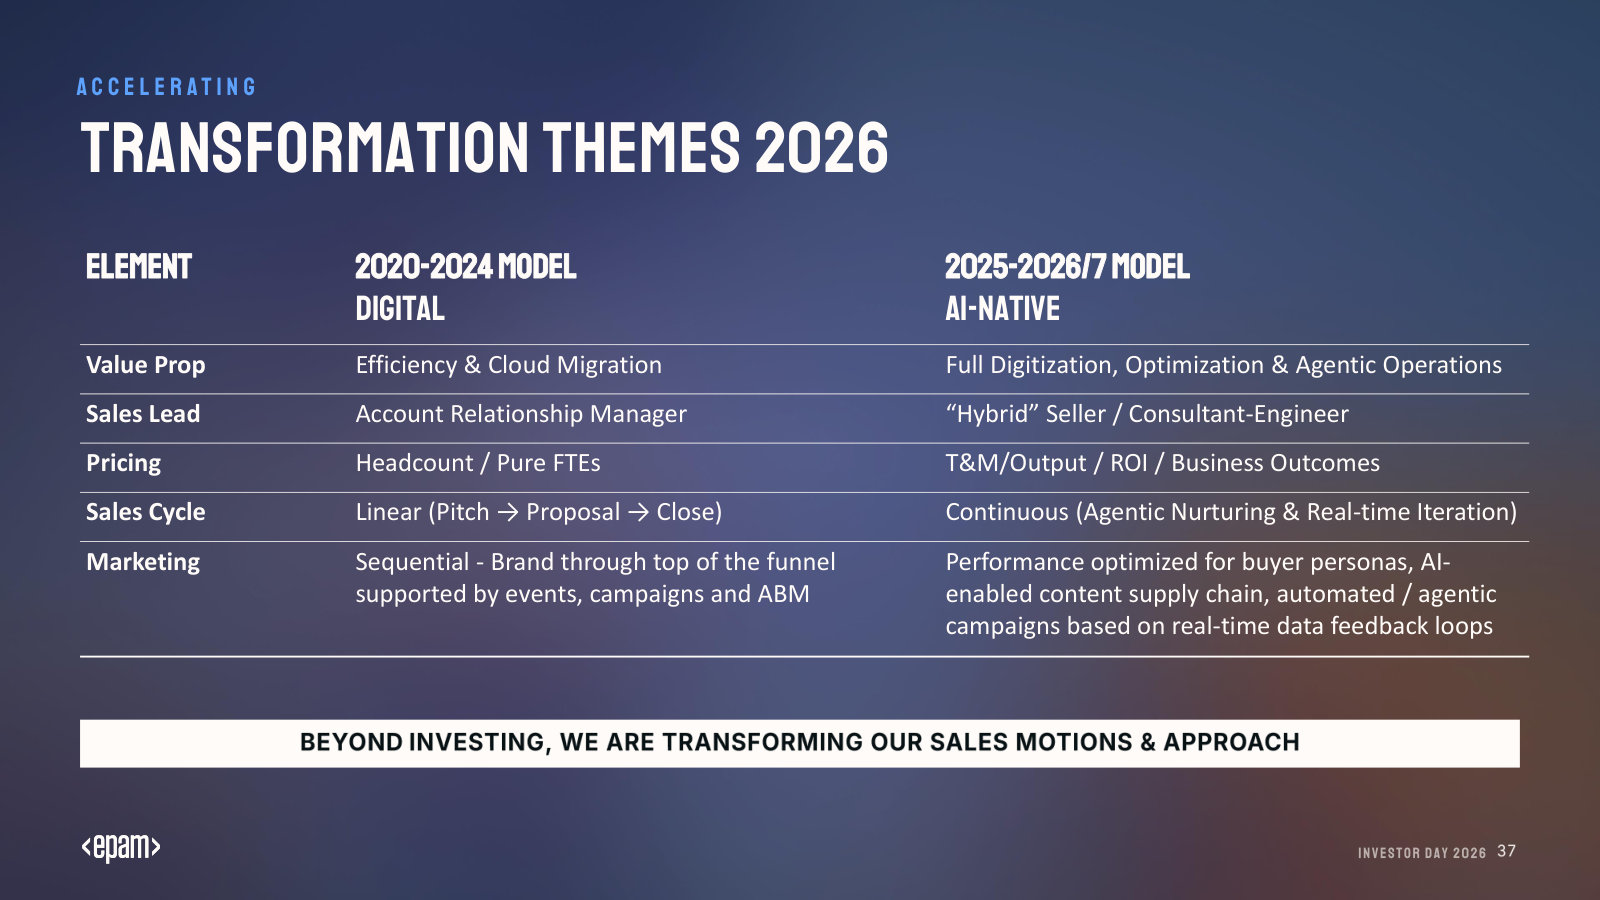
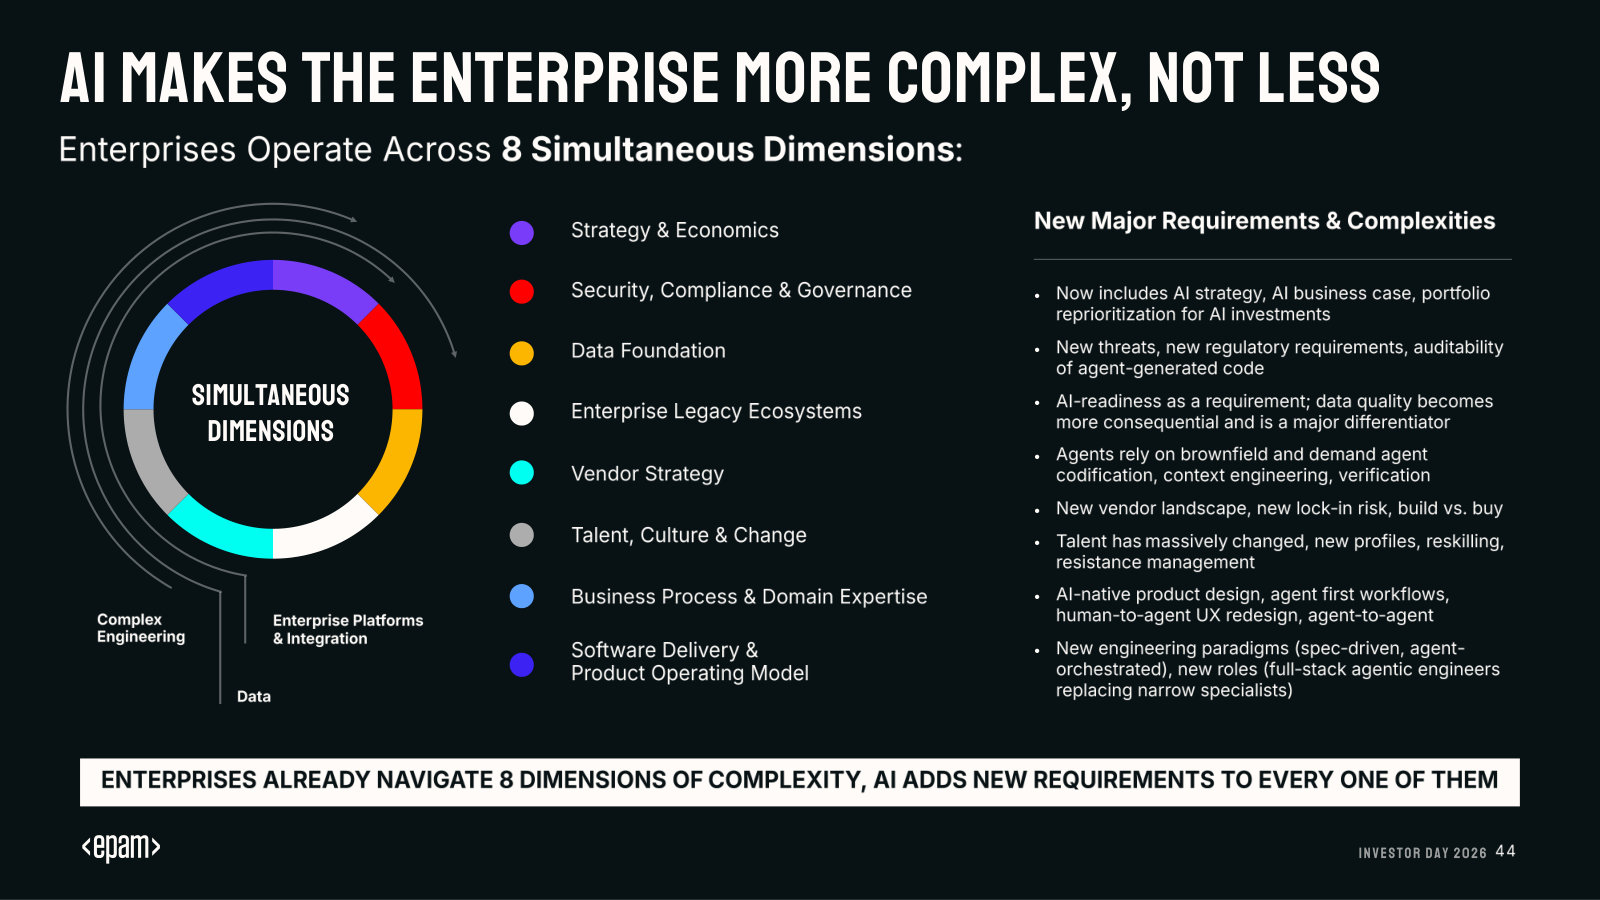
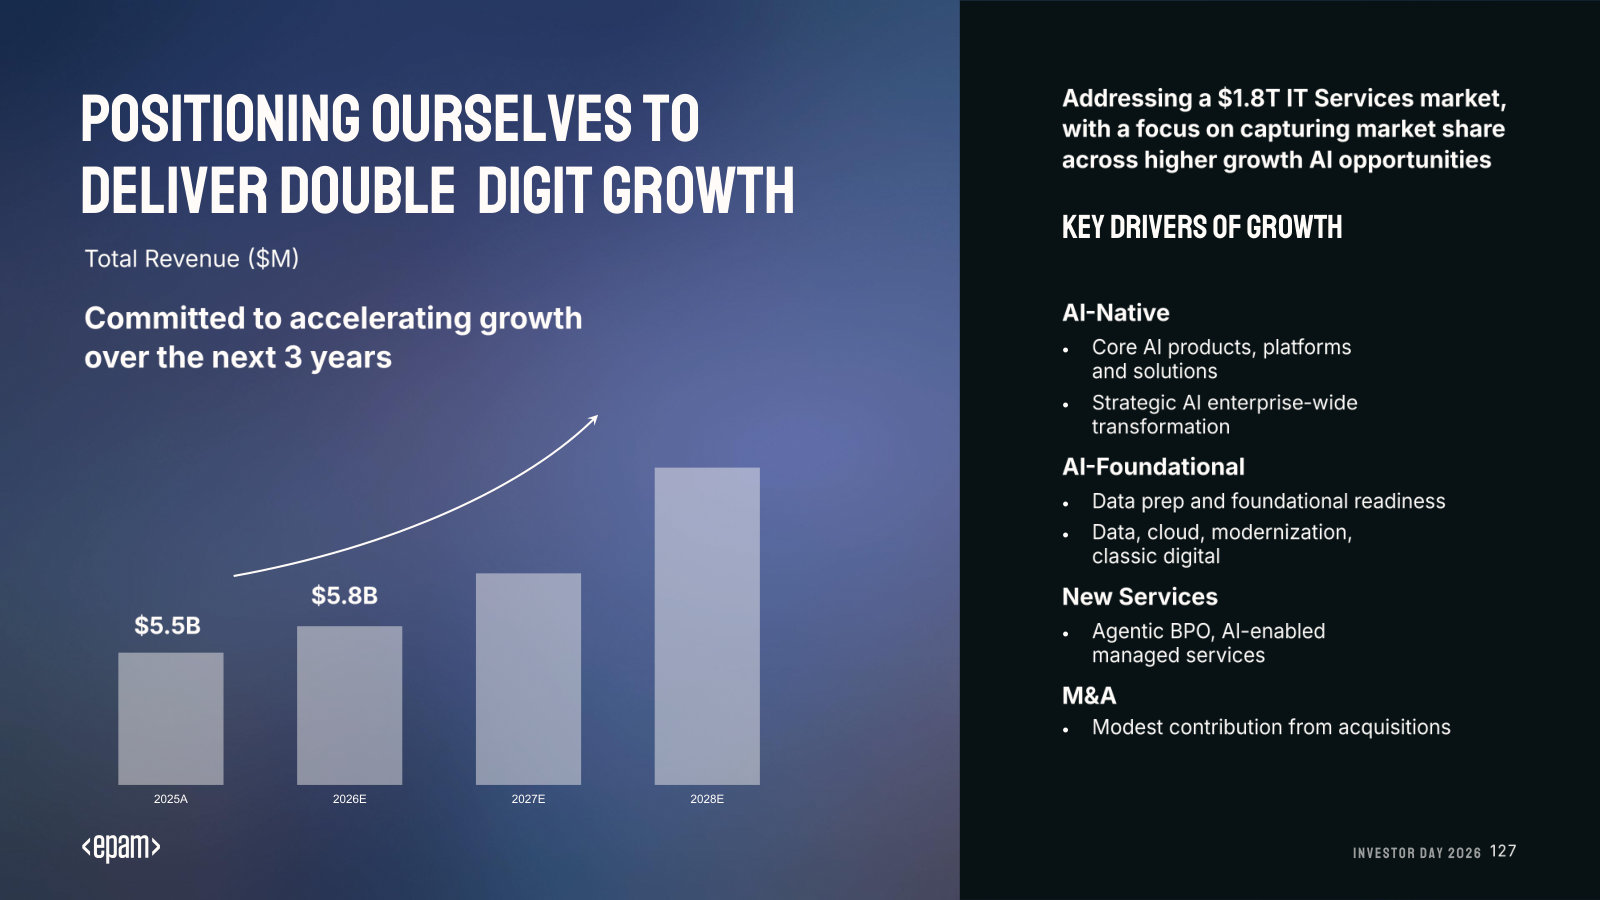
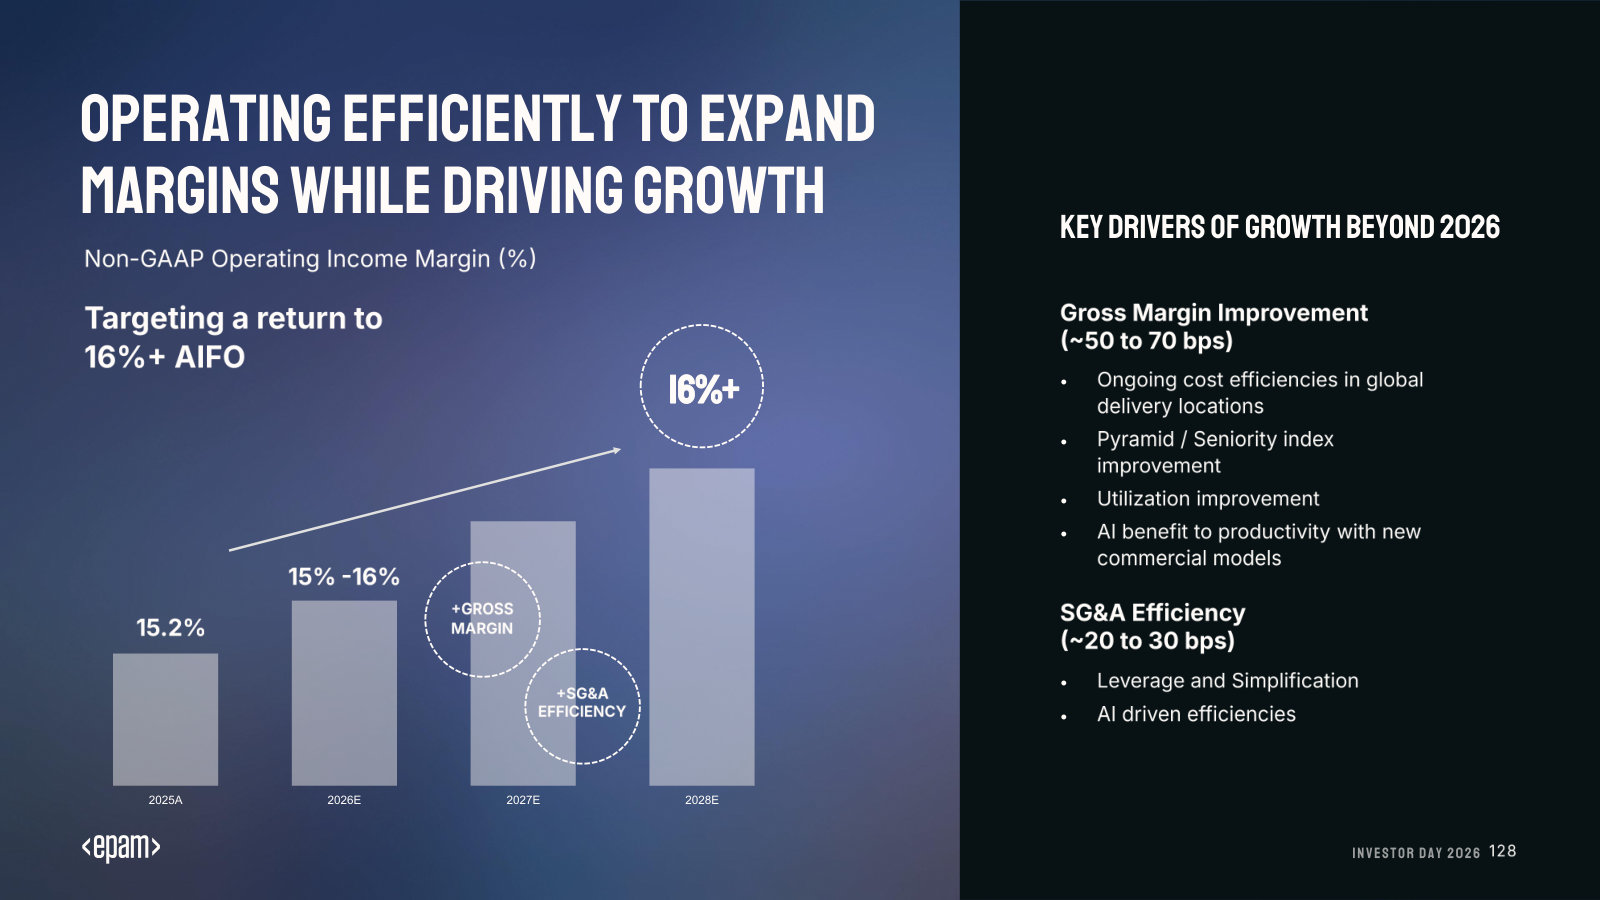
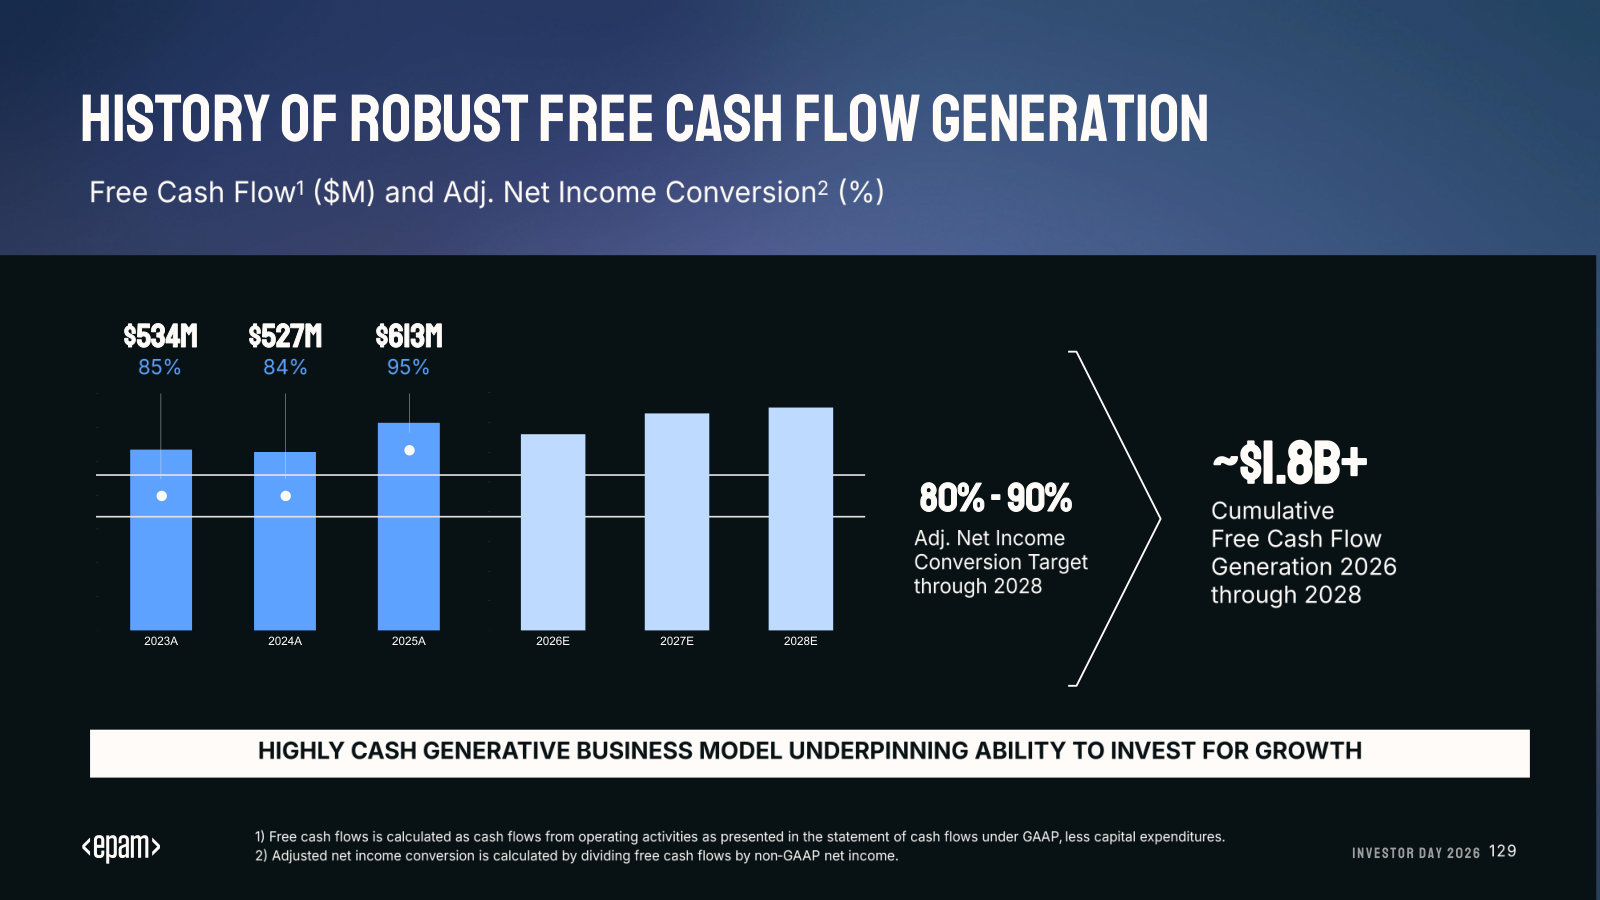
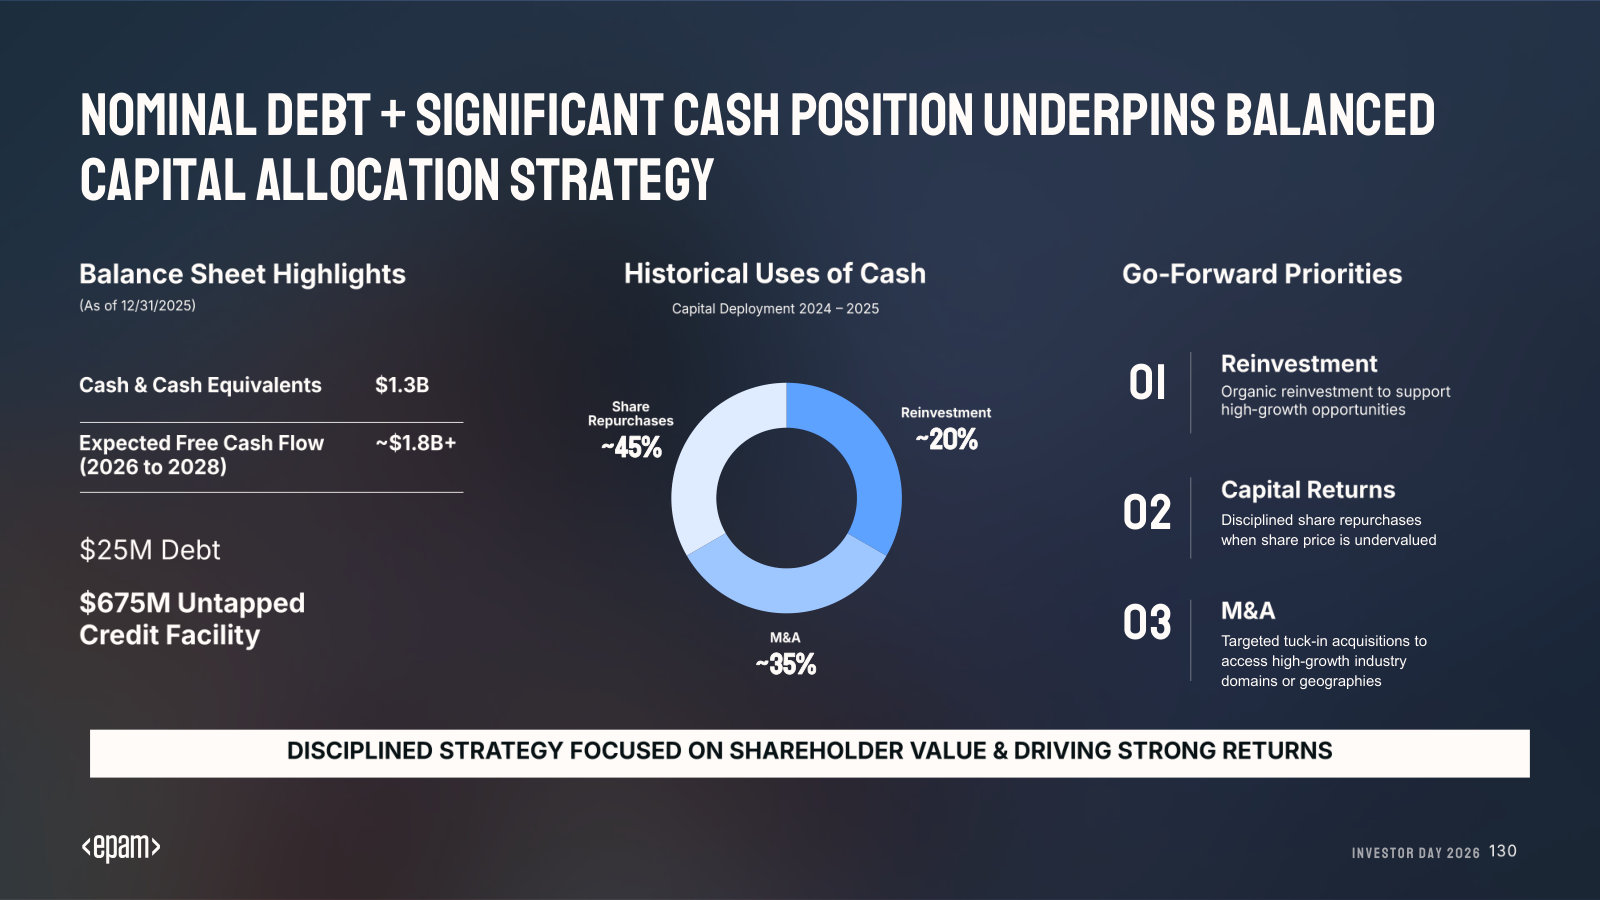
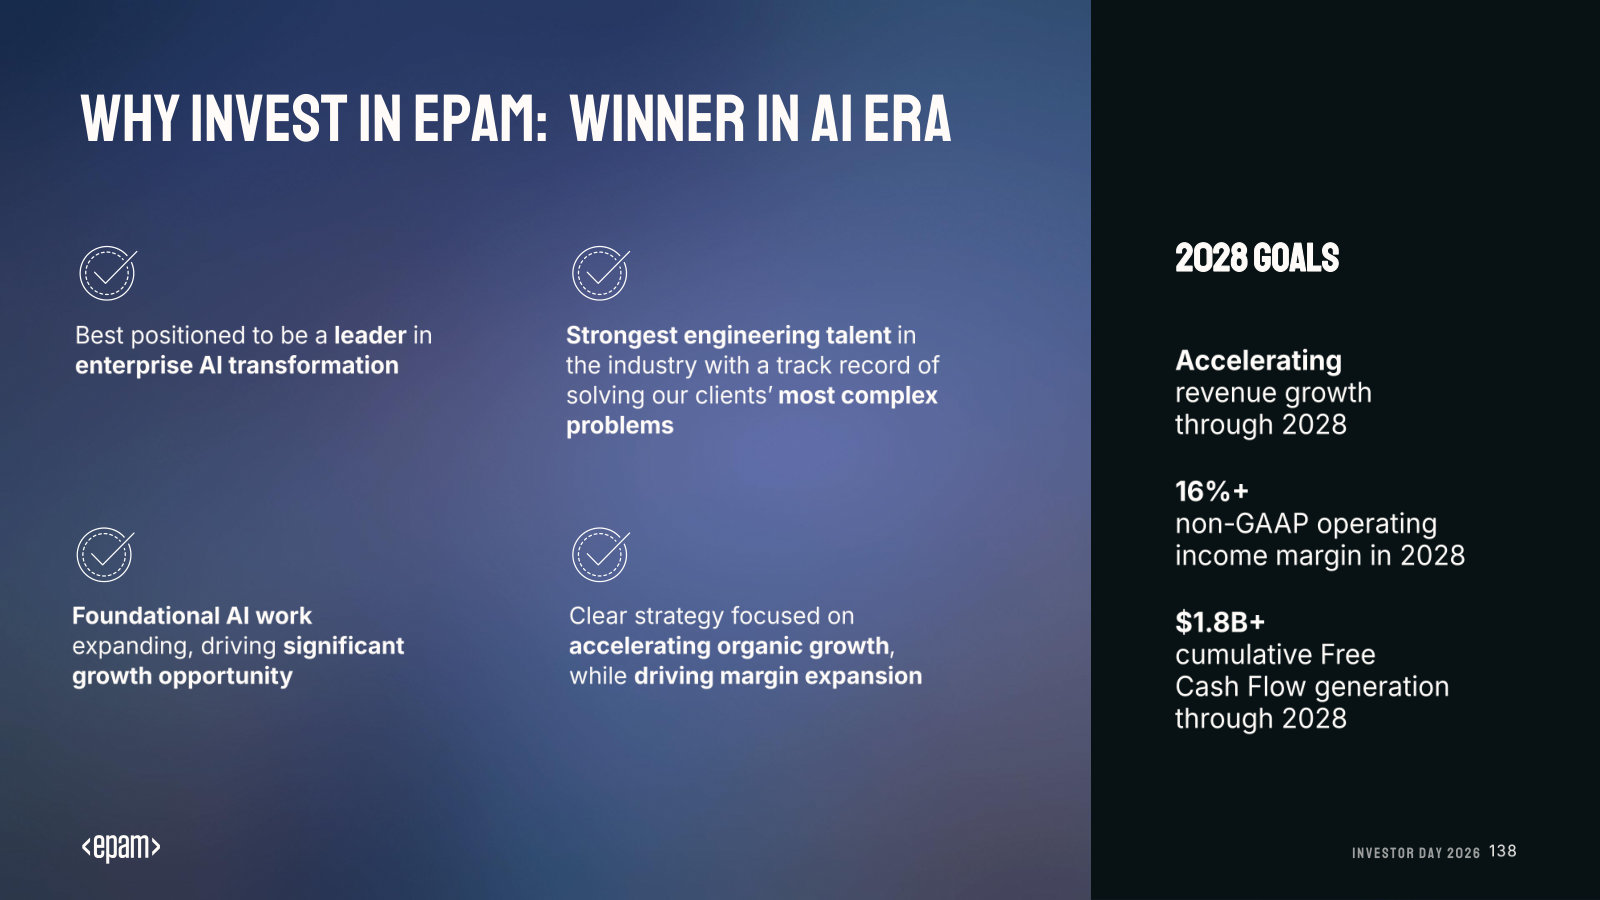
Investor Day 2026 — March 2026
Management's fullest current statement of what EPAM is, how it makes money, and its strategy, market and financial targets for the AI era. · Open the full document →
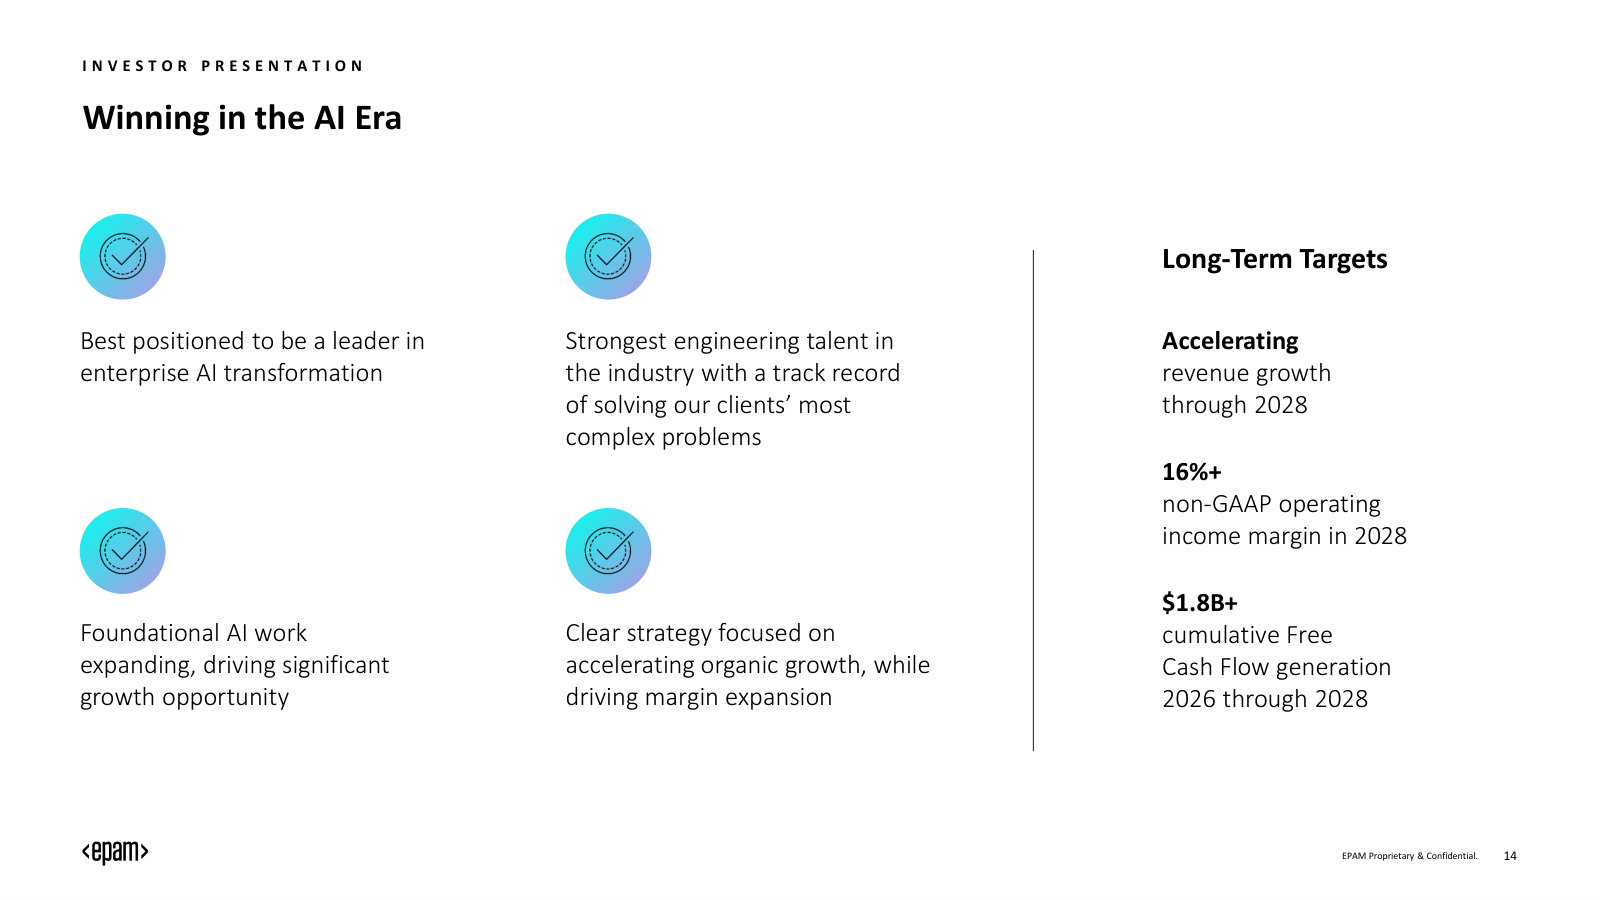
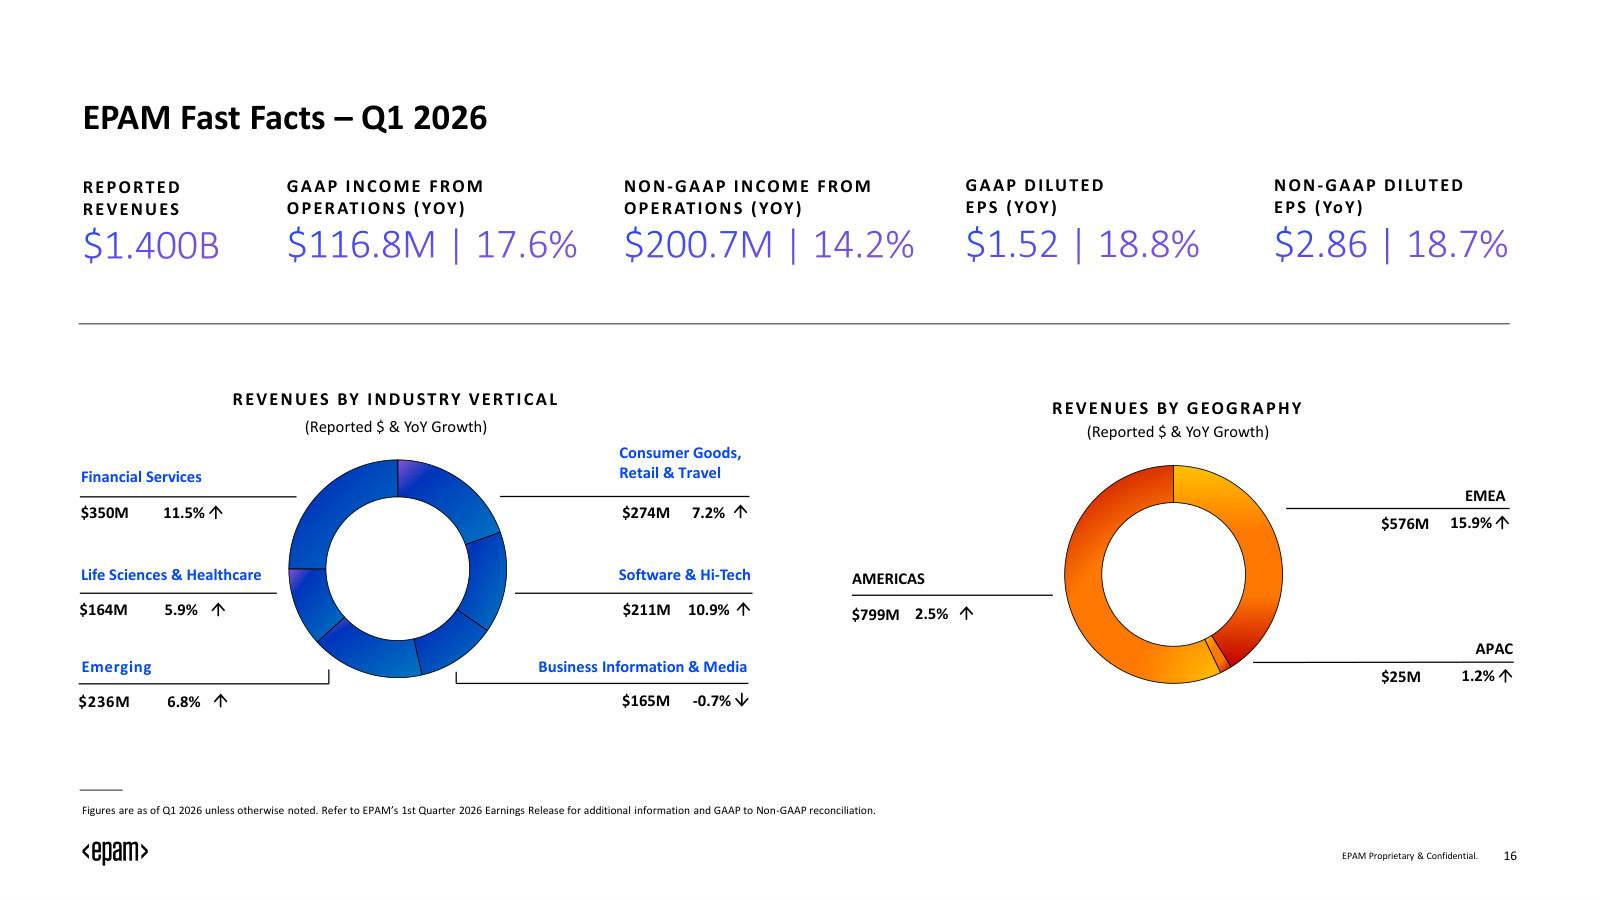
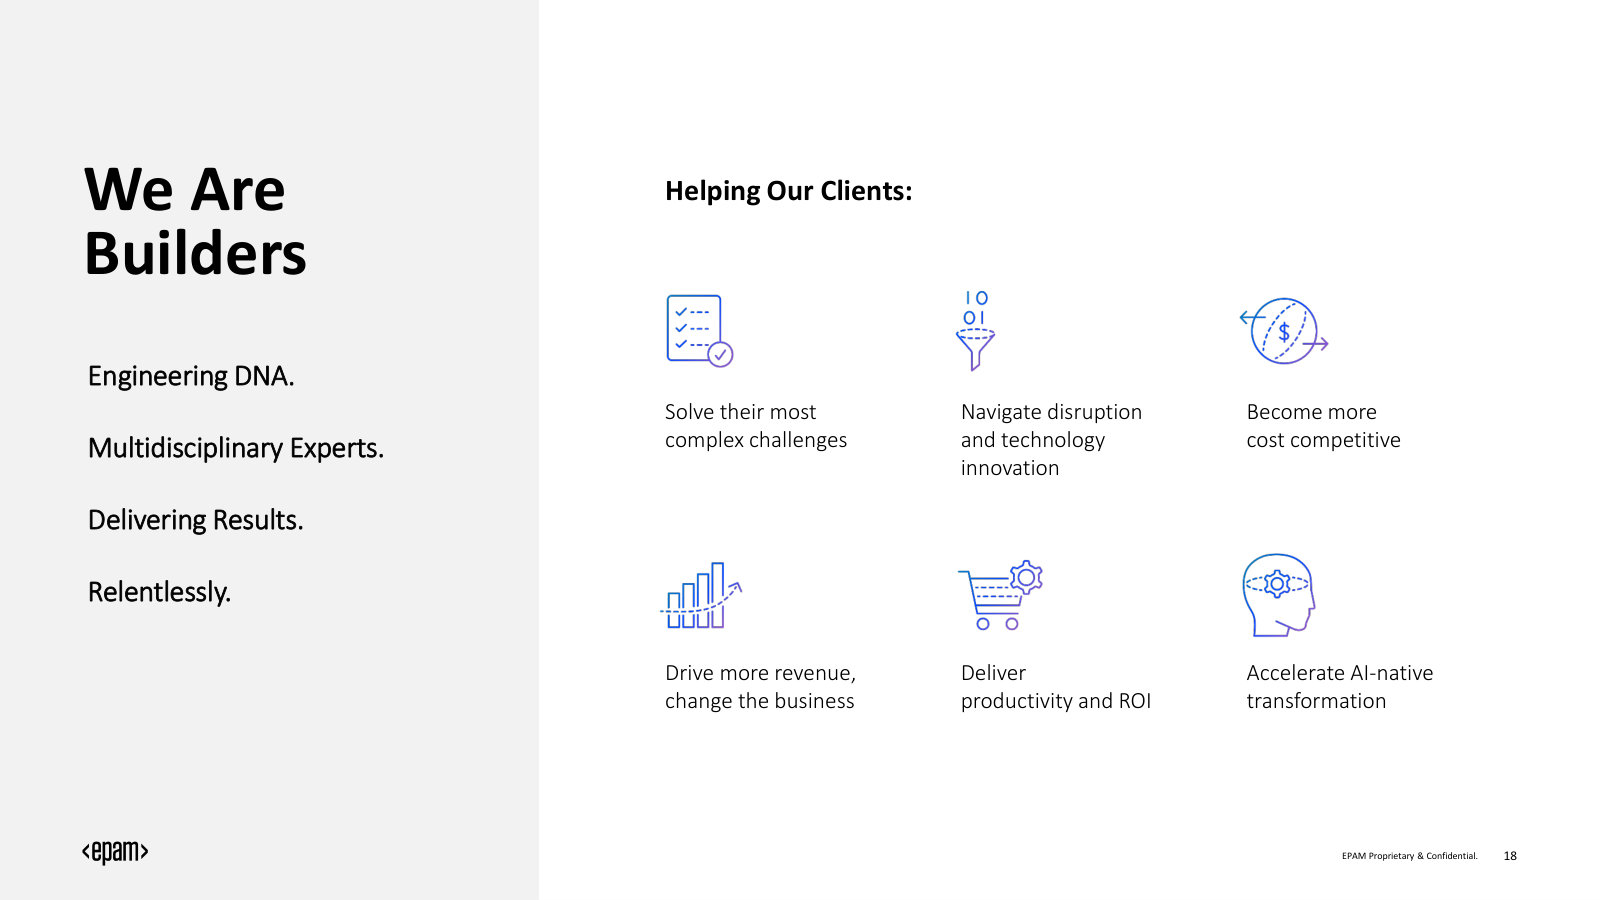
Investor Presentation — May 2026 — Q1 2026
The most current overview deck — a fast zero-to-understanding tour of the business plus the latest Q1 2026 results and full-year guidance. · Open the full document →
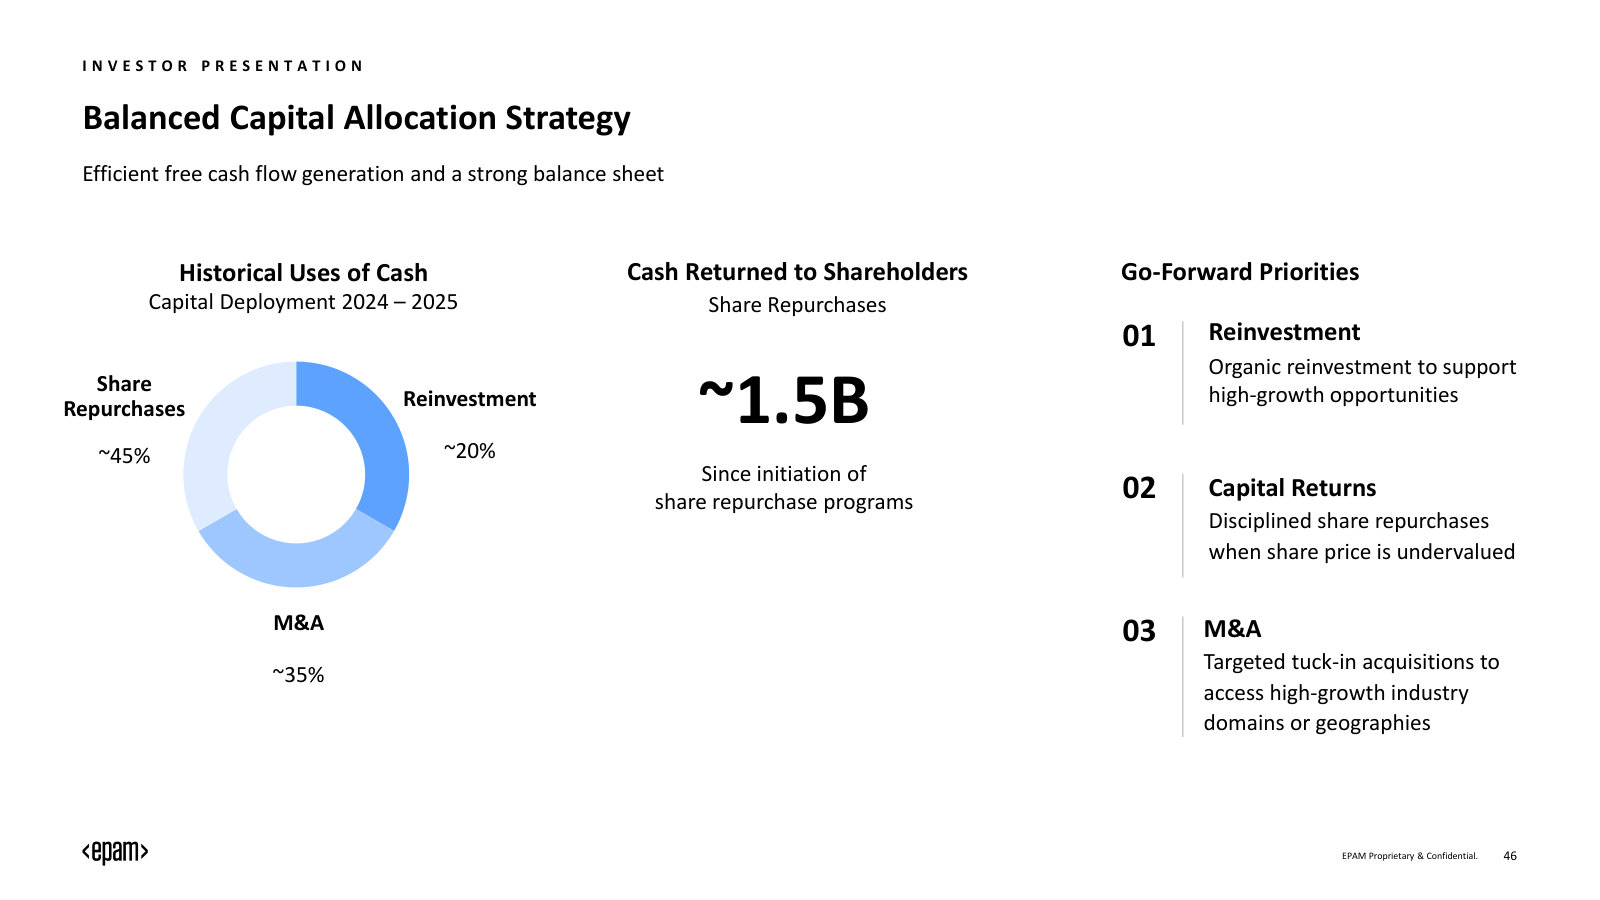
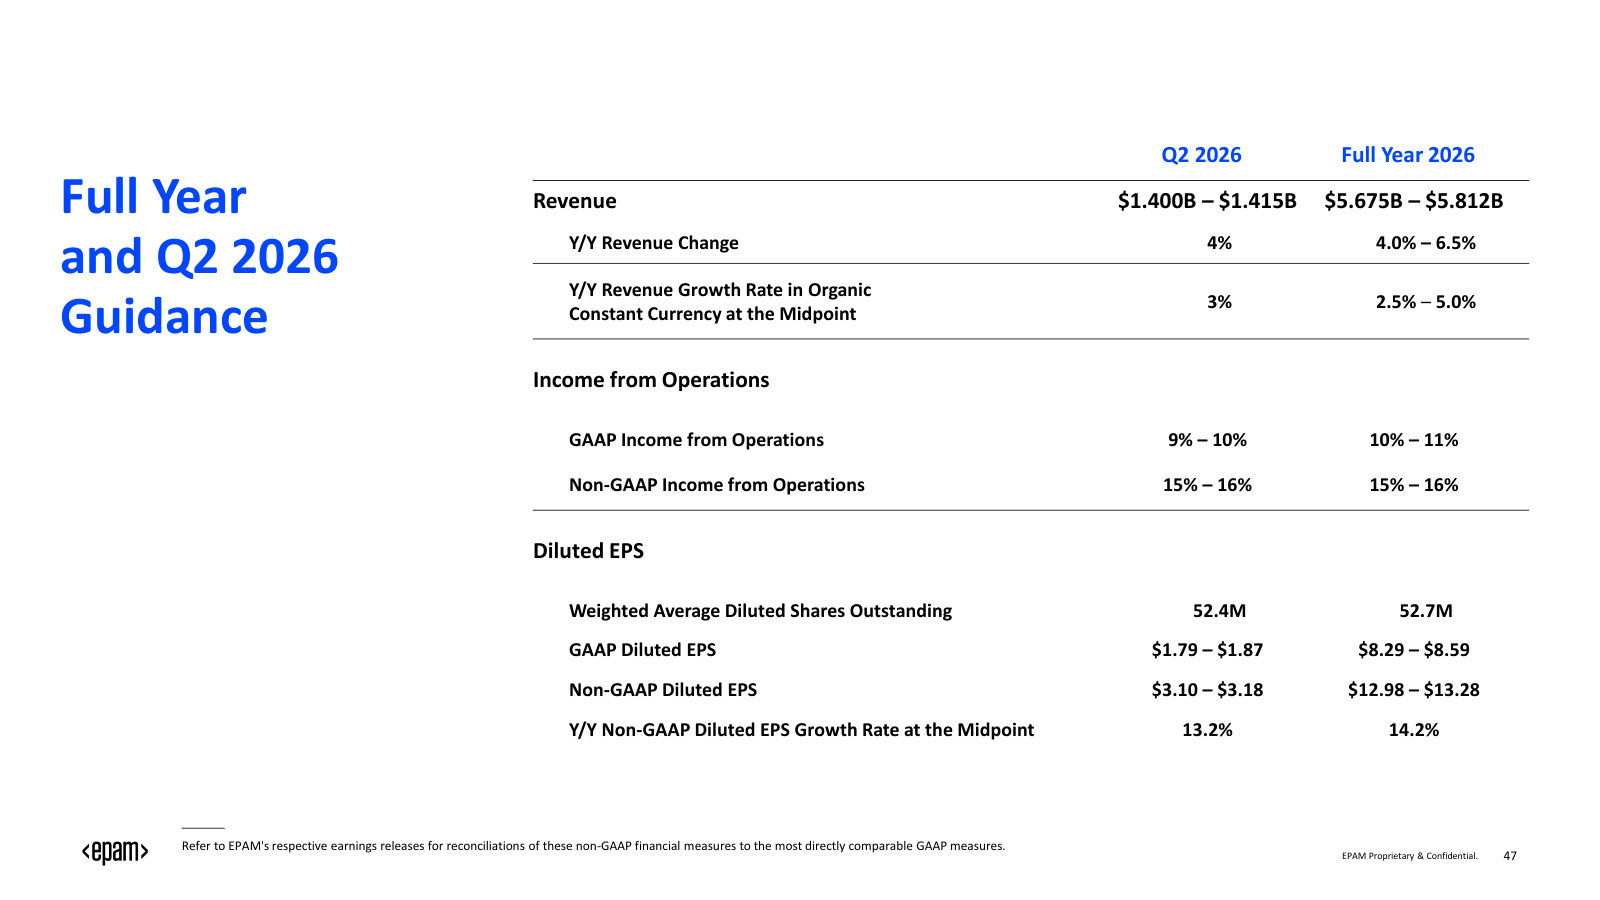
EPAM Systems, Inc.'s management answers for the business every quarter. These are the exchanges that explain it best — verbatim, from the call transcripts preserved in Sources. Each link opens the full transcript at that page in a new tab.
Q1 FY2026 Earnings Call — Q1 FY2026
The clearest read on EPAM's AI-era economics — the large-deal pipeline, token pricing, and why full-year guidance came down. · Open the full transcript →
Why the full-year growth outlook came down, and what management is—and isn't—assuming to reach the second half.
Bryan Bergin (TD Cowen); Balazs Fejes (CEO & President); Jason Peterson (CFO): On the 2026 guide and the organic growth revision, is this a handful of large engagements that are just moving slower or a broader portfolio dynamic, and what gives you the confidence on the second-half implied sequential growth, just given where the Q2 number is? Are you assuming geopolitical volatility moderates to hit that revised target? Do you have things in hand? Maybe a little detail on that. […] In our estimate, we are not assuming a significant change in the geopolitical environment. So we are guiding as we see it right now and are not assuming any major shifts. That said, as I noted in the prepared remarks, we have a number of unusually large opportunities that we're targeting. We are not yet certain how fast they will ramp or close, but our AI-native and AI/Run capabilities opened us up to a part of the market that was previously closed to us — specifically large vendor consolidation and large transformation deals. Those are included in our current guide to the extent we believe they are likely to convert.
p. 6 · Read in context →
The shape of the new large-deal pipeline: ~10 outsized vendor-consolidation deals, risk-adjusted into the guide.
Jason Kupferberg (Wells Fargo); Balazs Fejes (CEO & President); Jason Peterson (CFO): So those large opportunities — there's vendor consolidation deals. It sounds like it's not just two or three. Can you clarify how many and what the nature of the work is that comprises those large pipeline opportunities for the second half? […] It's no longer just three or four. We're talking about close to 10 significant opportunities at this point. These opportunities are outsized relative to our historical range. Many are not time & materials: they involve different commercial models […] From a risk-adjusted standpoint, we're not assuming we will win all of those opportunities. We're capturing a small subset in our models, and that subset contributes to the expected growth in the second half.
p. 7 · Read in context →
Can EPAM run programs this large—and what they earn: AI-native work runs above the corporate average margin.
Jonathan Lee (Guggenheim); Balazs Fejes (CEO & President): You highlighted large multiyear deals in the pipeline that are larger in scale than what EPAM has historically pursued. What gives you confidence in your ability to close and execute on those? Do you have the sales muscle, governance frameworks and delivery infrastructure to manage programs of that magnitude? How should we think about the profile of these deals regarding competitive dynamics, deal size and margin profiles relative to what you currently see? […] Great question. We were somewhat surprised at how successful our offering resonated and how quickly the pipeline built. We have the sales muscle to get into these opportunities, and our offering is differentiated because it brings AI-native capabilities that challenge the status quo. We are risk-adjusting the pipeline; we're not assuming full conversion or immediate ramp. EPAM has experience running large programs historically, though those were typically aggregates of many smaller engagements rather than single outsized deals. In terms of profitability, our current AI-native portfolio, which is over $125 million per quarter, runs at higher profitability than the EPAM average.
p. 9 · Read in context →
Who pays for tokens today, and the state of billing rates—no broad compression, some increases won.
Bryan Keane (Citi); Balazs Fejes (CEO & President): can you talk a little about contract pricing and how those dynamics have changed over the last year or so? In particular, with the Anthropic partnership, how will you recognize revenues in that contract? Is it any different than the model you've used in recent years? […] Pricing dynamics are a moving target and token economics continues to be an area of discussion. Today, in most client relationships clients are bearing the cost of tokens. We're exploring different commercial models, including when EPAM might charge for tokens, when clients pay directly, and how to structure security and compliance concerns. Anthropic is not fundamentally different in construct — we'll develop software using the Anthropic stack and explore appropriate commercial models with clients and Anthropic. Regarding pricing, Jason and I were pleased to see rate increases in Q1; we are not seeing broad rate compression at this time and have been successful negotiating rate increases with a minority of clients.
p. 10 · Read in context →
The AI-era cost lever: model choice, multi-sourcing and a 'trading-desk' to manage token economics.
James Faucette (Morgan Stanley); Balazs Fejes (CEO & President): On margins, especially for longer-duration projects and factoring in token costs, what levers do you need to control — model usage, sourcing, pricing — and what relationships do you need to develop? […] To control economics you need to control multiple aspects: model usage (which model is used for which task and how frequently), the right blend of models to balance capability and cost, and multi-sourcing capability so you can buy the same model service from multiple providers when appropriate. We need to build trading-desk-like capabilities to manage pricing, availability and consumption limits. If you correctly control sourcing and usage of models, you can achieve differentiation in pricing and profitability.
p. 11 · Read in context →
Q4 & Full Year FY2025 Earnings Call — Q4 FY2025
Where the 'AI-native' revenue segment is defined and the 2026 growth-and-margin framework is laid out. · Open the full transcript →
How EPAM defines 'AI-native' revenue—and what it deliberately excludes—plus the >$600M 2026 target.
Balazs Fejes (CEO & President): As a reminder, our AI-native revenues are defined across two groupings: number one, AI-native IP products, platforms, and solutions where AI was the core of the solution versus simple work accelerated by the use of AI tools; and number two, AI-led transformation initiatives across the entire enterprise. Importantly, our definition excludes all the AI foundational services along with any AIassisted work performed by EPAM Systems, Inc. employees within the software delivery lifecycle. Looking ahead, we continue to see robust demand for our AI-native services and expect to scale these revenues in excess of $600,000,000 in 2026.
p. 2 · Read in context →
The guidance frame: budgets stable, one large Mexico client a ~1pt drag, and the standing Ukraine-delivery assumption.
Jason Peterson (CFO): Before moving to the specifics of our 2026 and Q1 outlook, I would like to provide some thoughts to help frame our guidance. We are encouraged by the underlying momentum of our business and the steady outperformance delivered throughout 2025. We step into 2026 with higher confidence in our long-term strategy and growth trajectory, supported by healthy client sentiment, a solid pipeline, and strong momentum in AI-native and AI foundational services. We see relative stability in overall client budgets, with a continued shift in spending towards build and strategic AI programs. […] The full year 2026 revenues from this client will decrease relative to 2025, and this decrease is expected to have a negative 1% impact on EPAM Systems, Inc.’s 2026 organic constant currency growth rate. In 2026, we remain committed to improving overall profitability, and specifically gross margin. Our guidance assumes that we will be able to continue to deliver from our Ukraine delivery centers at productivity levels similar to those achieved in 2025.
p. 5 · Read in context →
Why 2026 organic guidance is below 2025's result—and the philosophy of guiding only to what's visible.
Jonathan Lee (Guggenheim); Jason Peterson (CFO): last quarter, you called out an expectation of 2026 organic growth being faster than that of 2025. With that in mind, can you help us reconcile that commentary to the 2026 outlook that, at the midpoint on organic constant currency basis, is slower than what you delivered in 2025? Is that due to Neoris’ largest client? Are there any other factors there? […] Yeah. Jonathan, thanks for the question, and it is certainly a good one. And so you are right. I think we had 4.9% organic constant currency growth in 2025. The midpoint of the range would produce 4.5%. Since the last time we talked, as I told Maggie, we did get incremental information on the Neoris largest client. As I called out in my fixed remarks, we expect the decline on a year-over-year basis will have a negative 100 basis point impact on growth. So you have got the 4.5% at the midpoint of our range. Obviously, it would be 100 basis points higher on the rest of the business. I think the other thing that we are trying to do from a guidance standpoint is to make certain that we guide to what we can see today. We are not assuming improvement in environment. Clearly, we have got some opportunities that we talked about throughout the remainder of the year. And so we are clearly going to work to drive towards better, and we will update you on our progress throughout the year.
p. 7 · Read in context →
Q1 FY2022 Earnings Call — Q1 FY2022
How management steered through the Russia-Ukraine shock that put EPAM's entire delivery model to the test. · Open the full transcript →
The delivery-footprint math: how fast EPAM is cutting its Ukraine/Belarus/Russia concentration.
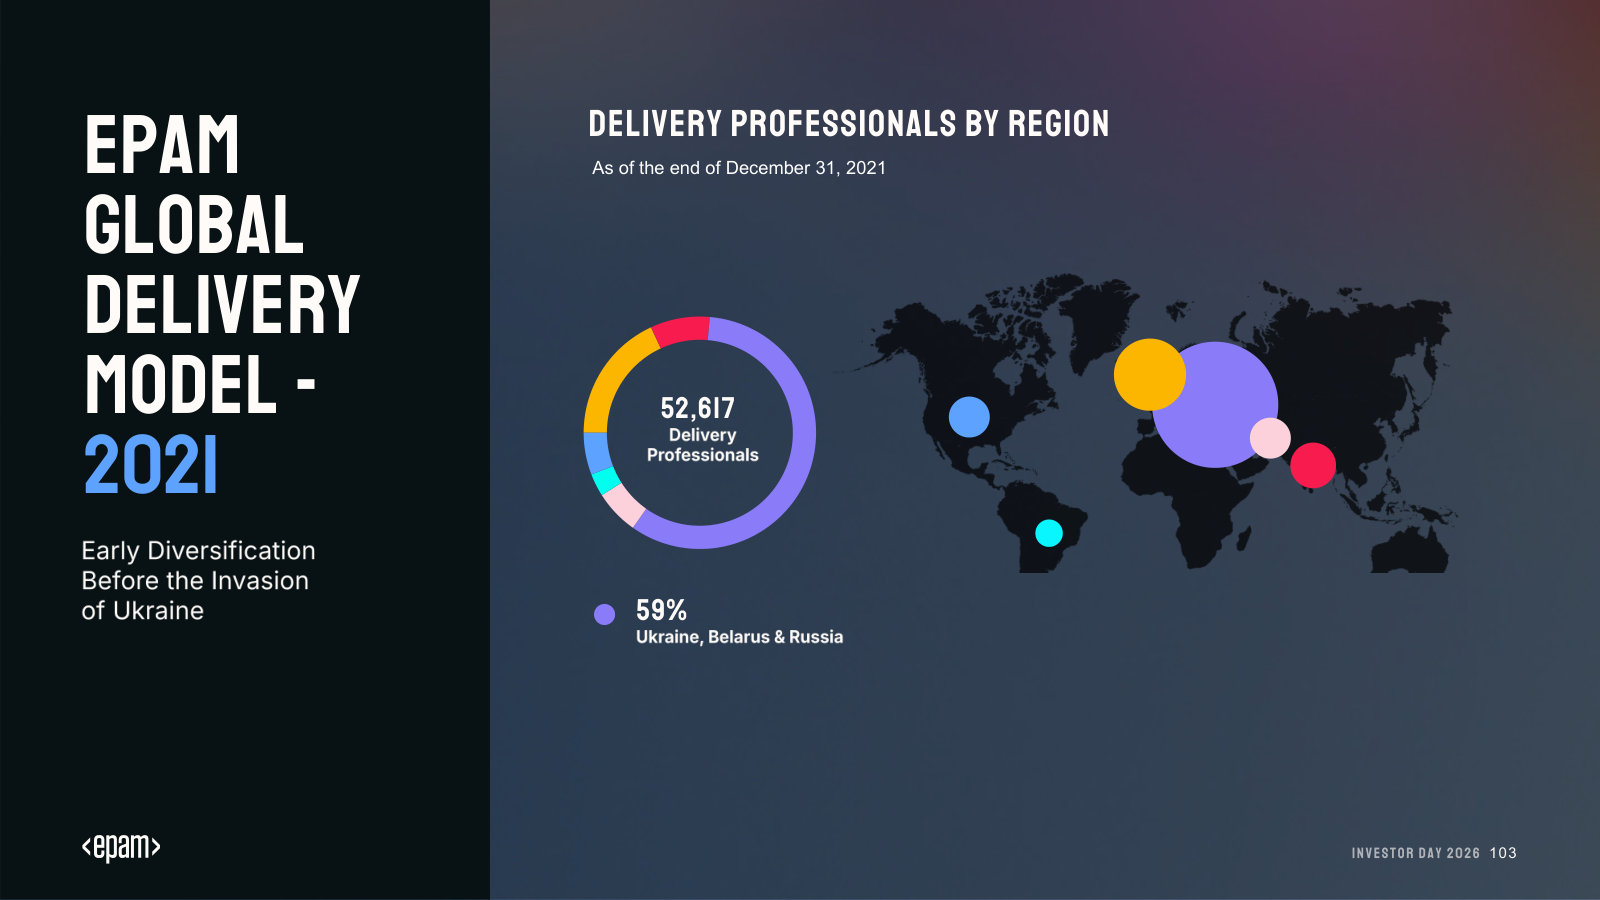
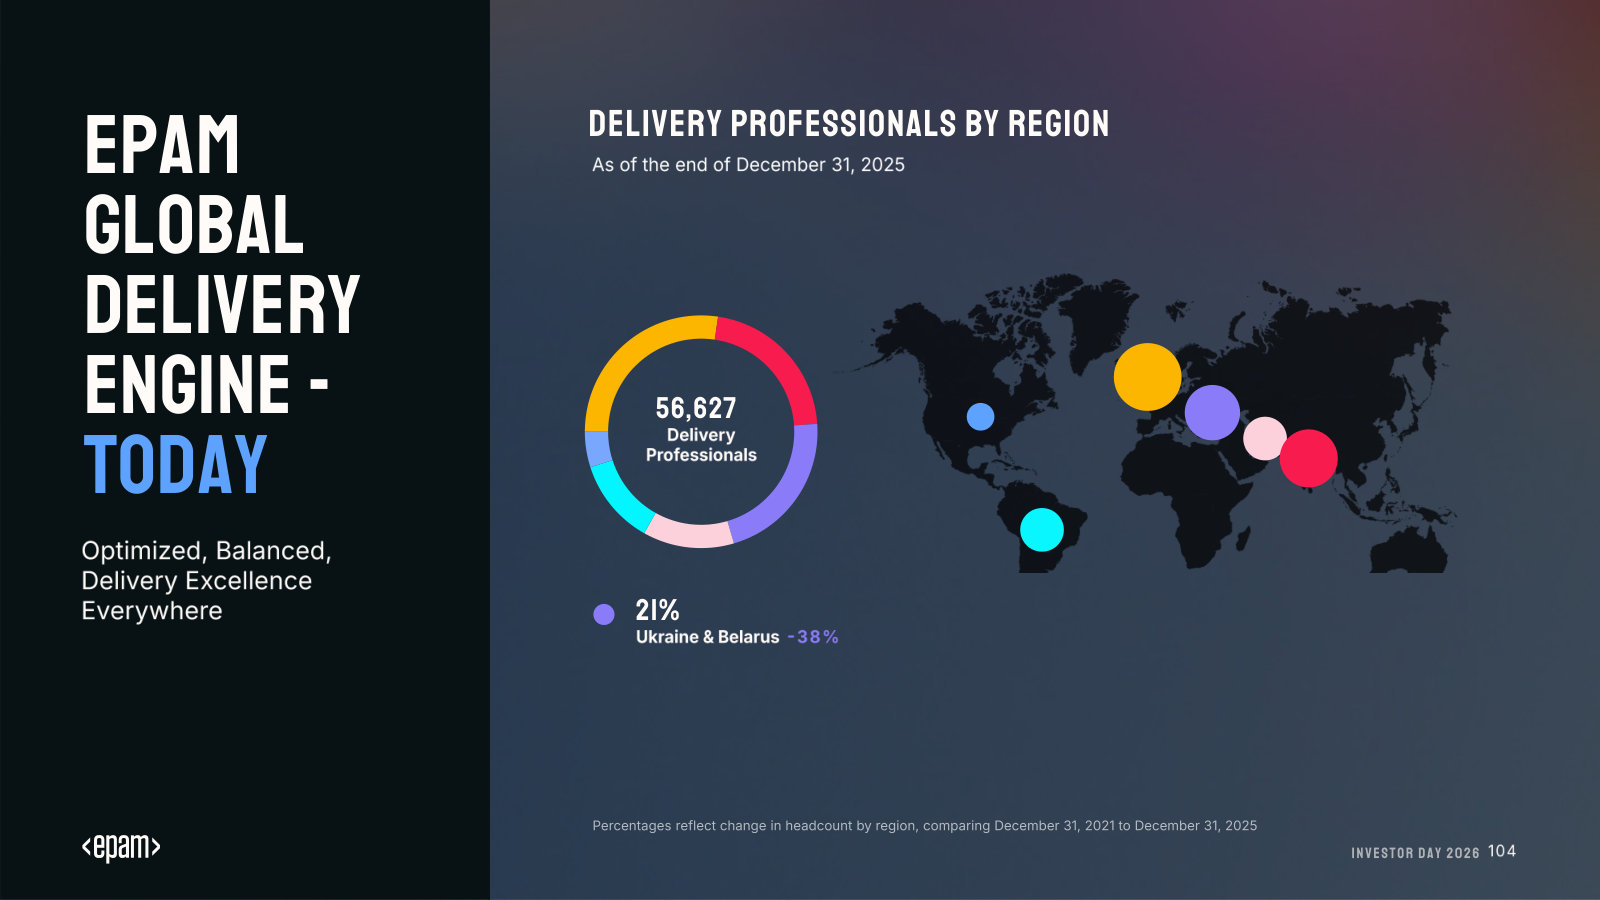
Arkadiy Dobkin (CEO & President): I would also point out that in large part, this diversification program was well underway even during the past several years. Before COVID, our allocation to the talent from Ukraine, Belarus and Russia was close to 70% of our total production capacity. By the end of 2021, it was less than 60%. And we believe, by the end of 2022, we will manage to reduce the allocation of our production staff in the region to about 30%.
p. 6 · Read in context →
What the shock cost: Russia exit, asset impairments, humanitarian spend and accelerated relocation.
Jason Peterson (CFO): Thank you, Ark, and good morning, everyone. In the first quarter, EPAM delivered strong results despite the impact of the company's decision in March to discontinue services to customers based in Russia. In Q1, we also incurred some of the initial costs resulting from Russia's invasion of Ukraine and the acceleration of our geographic diversification strategy. Certain of these costs, including the expenditures related to EPAM's humanitarian commitment to Ukraine, charges for impairment of Russian longlived assets and costs associated with accelerated employee relocation have been excluded from non-GAAP financial results.
p. 8 · Read in context →
Guidance philosophy under crisis: outlook withdrawn, quarter-only guidance until 2023.
Jason Peterson (CFO): Now let's turn to our business outlook. On February 28, we withdrew our business outlook due to the uncertainties related to Russia's invasion of Ukraine. For the remainder of this year, we plan to provide guidance for the next quarter only, with the expectation of resuming our full year guidance at the beginning of the 2023 year. Additionally, to help align with our thinking around significant events, let me provide a few broad assumptions which will help frame our guidance for Q2 and the remainder of 2022.
p. 11 · Read in context →
More calls
Investor Day (AI Day) — Investor Day · 144 pages · The full multiyear AI-transformation strategy — the three strategic pillars and long-term targets that the 2026 earnings calls keep referring back to. · Open →
Q3 FY2025 Earnings Call — Q3 FY2025 · 10 pages · The first clean quarter under CEO Balazs Fejes; the AI-native scaling story that sets up Investor Day. · Open →
Q1 FY2025 Earnings Call — Q1 FY2025 · 10 pages · The leadership handover from founder Arkadiy Dobkin to Balazs Fejes. · Open →
Q4 & Full Year FY2022 Earnings Call — Q4 FY2022 · 36 pages · EPAM resumes full-year guidance for the first time since withdrawing it during the war — the post-shock reset. · Open →
Q2 FY2022 Earnings Call — Q2 FY2022 · 37 pages · The first post-invasion quarter of stabilization, with the employee-relocation program mid-flight. · Open →
Q4 & Full Year FY2021 Earnings Call — Q4 FY2021 · 40 pages · The pre-war call: a confident 37% growth guide and 10-year IPO retrospective, days before the invasion upended it. · Open →
EPAM Systems, Inc.'s annual reports contain management's most considered account of the business. These are the sections, passages and visual pages worth opening in the originals preserved in Sources.
EPAM Systems, Inc. — FY2025 Annual Report (Form 10-K) — FY2025
The latest 10-K — how EPAM runs its people and rebalanced delivery base, and the geopolitical and AI risks that most directly threaten it. · Open the full document →
Item 1. Business — p. 5 · Read the full section →
Management's own framing of what EPAM sells — software engineering plus consulting, now pivoting to end-to-end AI-native transformation.
Overview: from software-engineering roots to AI-enabled transformation and consulting.
EPAM has used its software engineering expertise to become a leading global provider of digital engineering, cloud and artificial intelligence-enabled transformation services, and a leading business and experience consulting partner for global enterprises and ambitious start-ups. We address our clients’ transformation challenges by fusing EPAM Continuum’s integrated strategy, experience and technology consulting with our 30+ years of engineering execution to speed our clients’ time to market and drive greater value from their innovations and digital investments.
p. 5 · Read in context →
Global Delivery Model — p. 9 · Read the full section →
EPAM's cost engine is where its engineers sit; this is the post-war rebalance to an India-led footprint with Ukraine still core.
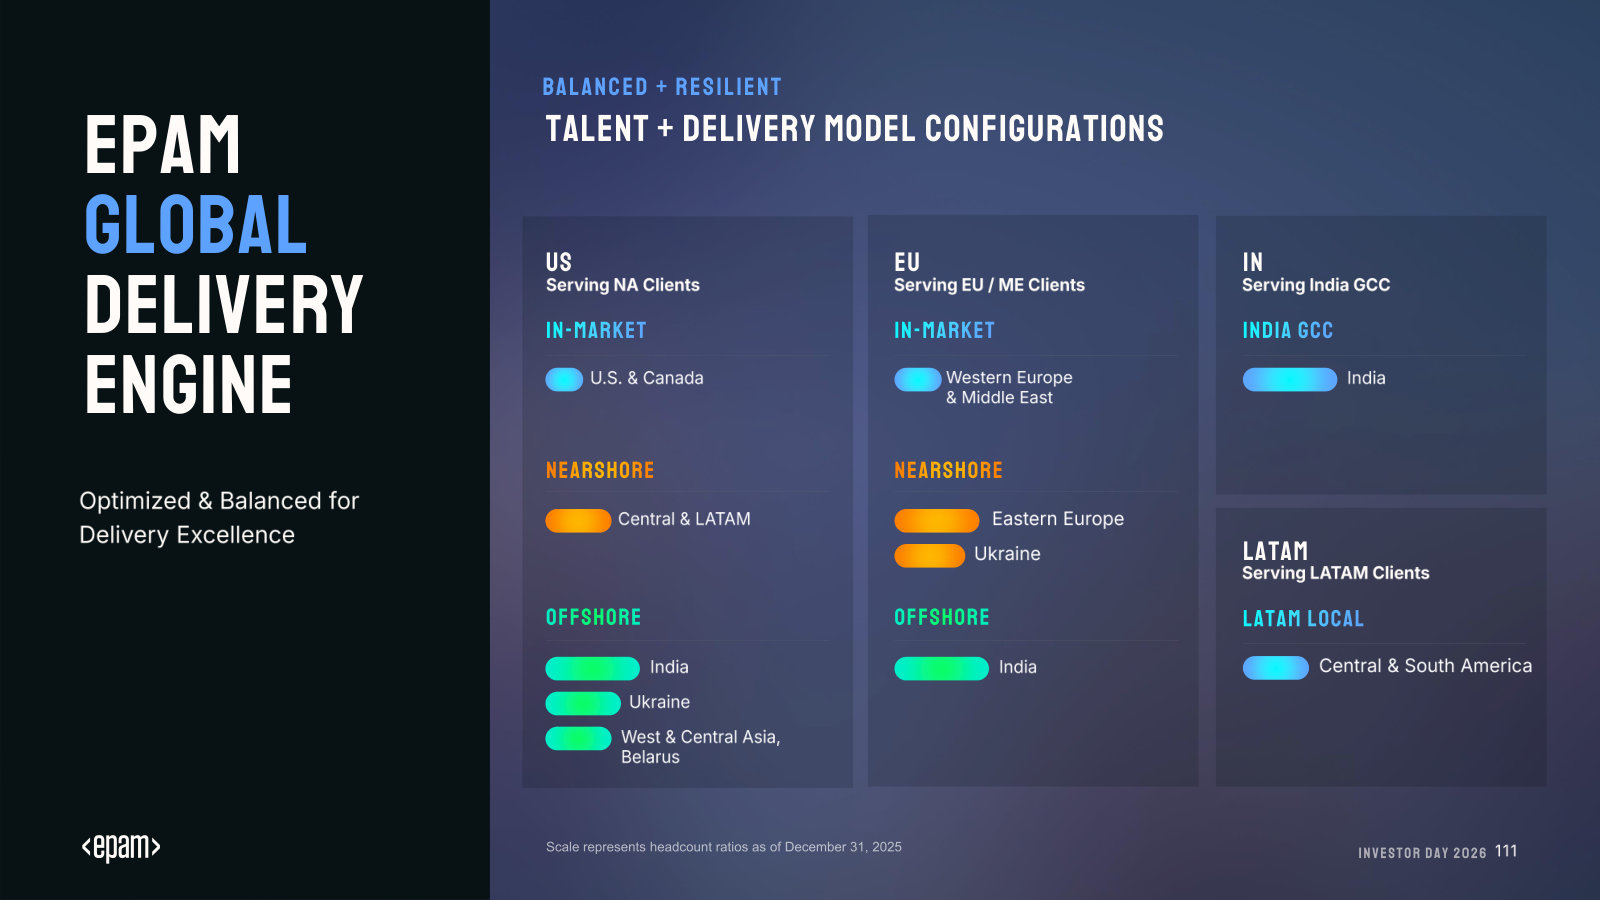
Delivery headcount by location: India now largest (~12,200); Ukraine ~8,750; Poland/Belarus/Mexico behind.
In 2025, India remained our largest delivery location, measured by the number of delivery professionals, and as of December 31, 2025, we had approximately 12,200 delivery professionals in this location. We continued to focus on growing India as a key delivery location and added approximately 2,150 delivery professionals since December 31, 2024.
Ukraine continues to be a significant delivery location for us and we had approximately 8,750 delivery professionals there as of December 31, 2025, compared with 8,764 delivery professionals as of December 31, 2024. […] Our other large delivery locations are Poland, Belarus and Mexico with approximately 5,050, 3,400 and 2,950 delivery professionals, respectively, as of December 31, 2025.
p. 9 · Read in context →
Human Capital — p. 11 · Read the full section →
In a services business people are the product; headcount and utilization are the operating levers that drive margin.
~62,850 employees (~56,600 delivery); delivery utilization ~76.8% in 2025.
As of December 31, 2025, 2024 and 2023, we had approximately 62,850, 61,200, and 53,150 employees, respectively, of which approximately 56,600, 55,100, and 47,350 were delivery professionals, respectively. […] For the years ended December 31, 2025, 2024 and 2023, the utilization rates of our delivery professionals were approximately 76.8%, 76.7%, and 74.3%, respectively.
p. 11 · Read in context →
Item 1A. Risk Factors — Risks Related to Geopolitical Events — p. 14 · Read the full section →
The company-defining exposure: ~14,100 people in Ukraine and Belarus, both in a war zone, with clients able to block delivery from there.
~14,100 delivery, administrative and support personnel based in Ukraine and Belarus.
We have significant operations and personnel in Ukraine and Belarus. Ongoing conflict and disruption in the region following Russia’s invasion of Ukraine in February 2022 has had and could continue to have a material adverse effect on our operations, personnel, business, clients, service delivery, and financial results.
In particular, as of December 31, 2025, approximately 14,100 of our global delivery, administrative and support personnel were based in Ukraine and Belarus, both of which are involved in or affected by Russia’s invasion of Ukraine.
p. 15 · Read in context →
Item 1A. Risk Factors — Risks Related to Artificial Intelligence — p. 16 · Read the full section →
The existential question for IT services: AI tools that let clients build software themselves — a risk management ties to the stock price.
AI-based tools as substitutes for EPAM's services — a risk management ties to the share price.
Increased competition, or the perception of increased competition, from new and non-traditional market participants like AI-based task-specific tools, has negatively impacted the price of our stock. If a significant number of our existing or future clients employ AI-driven tools as a replacement for our services or the software we build, our revenues, anticipated growth and prospects, our financial condition, and our results of operations could be materially adversely affected.
p. 16 · Read in context →
Item 7. Management's Discussion and Analysis — p. 41 · Read the full section →
Where management explains what moved 2025: 15.4% growth that was largely acquisition- and FX-driven, against a falling operating margin.
2025 revenue rose 15.4% to $5.457B, but ~9.2pp came from acquisitions and 1.3pp from FX.
During the year ended December 31, 2025, our total revenues increased 15.4% from the previous year to $5.457 billion. Revenues from the first twelve months following each acquisition that was made in the fourth quarter of 2024, increased our revenues by 9.2% and fluctuations in foreign currency increased our revenues by 1.3% during the year ended December 31, 2025 as compared to the previous year.
p. 45 · Read in context →
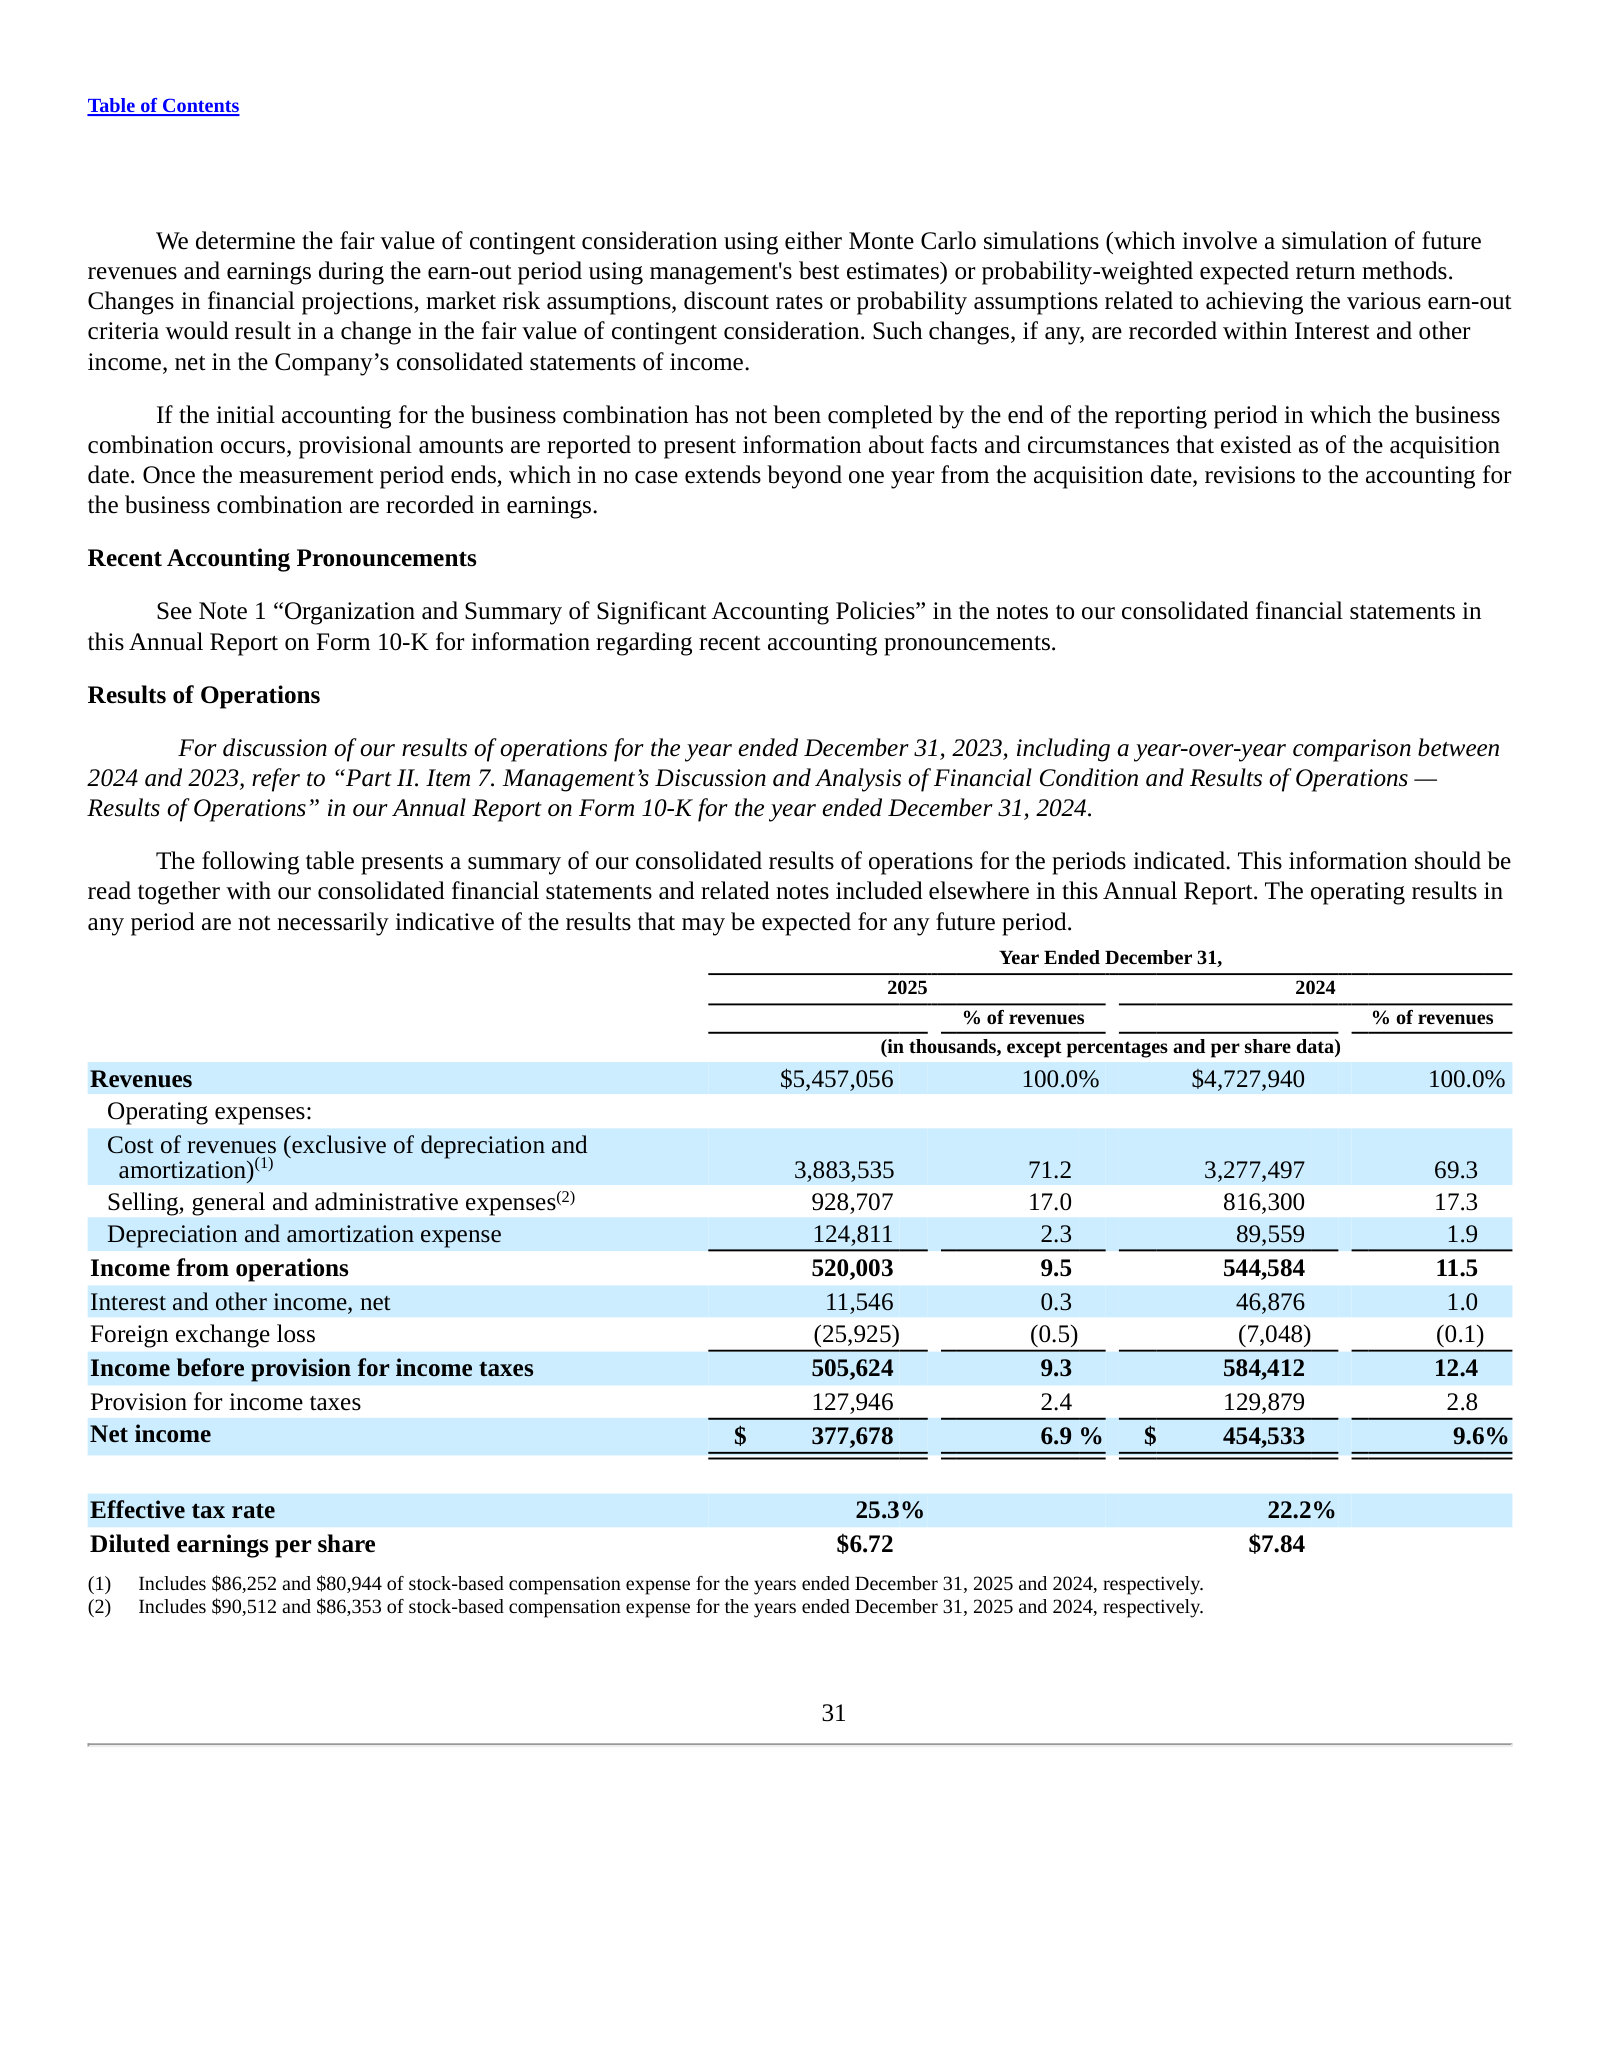
Item 7. MD&A — Results by Business Segment — p. 49 · Read the full section →
The segment view shows where growth and margin actually came from: Americas softening while Europe re-accelerated.
Americas operating profit fell 3.6% on 2024-acquisition dilution, lower Poland R&D incentives, FX and higher variable comp.
During 2025 as compared to 2024, Americas segment operating profits decreased $19.3 million, or 3.6%, to $522.1 million. […] This decrease is primarily attributable to the impact of lower profitability from acquisitions completed in 2024, lower government incentives related to conducting R&D activities in Poland, changes in foreign exchange rates, and an increase in variable compensation expense as a percentage of segment revenues during 2025 compared to 2024.
p. 50 · Read in context →
EPAM Systems, Inc. — FY2021 Annual Report (Form 10-K) — FY2021
Filed the day after Russia invaded Ukraine, it captures the pre-war delivery base the FY2025 report shows dismantled. · Open the full document →
Global Delivery Model — p. 9 · Read the full section →
The before picture: EPAM's three largest delivery centers were Ukraine, Belarus and Russia — then judged unaffected by regional risk.
More annual reports
EPAM Systems, Inc. — FY2024 Annual Report (Form 10-K) — FY2024 · 113 pages · The year of the NEORIS and First Derivative acquisitions that drove much of FY2025's reported growth. · Open →
EPAM Systems, Inc. — FY2023 Annual Report (Form 10-K) — FY2023 · 114 pages · The demand-slowdown year management repeatedly points back to when explaining uneven growth. · Open →
EPAM Systems, Inc. — FY2022 Annual Report (Form 10-K) — FY2022 · 102 pages · The first full-year report after the invasion, documenting the exit from Russia and the start of the delivery rebalance. · Open →
Competitors describe EPAM Systems, Inc.'s market in their own filings and calls. These verified passages and visual pages show where their strategies meet, using source documents preserved in Sources.
Endava plc (DAVA)
Endava is EPAM's closest listed pure-play analog — a next-generation digital-engineering firm with nearshore delivery across Central/Eastern Europe and Latin America and an “AI-native” positioning — and it names EPAM Systems by name as a primary competitor in its 20-F.
Endava's FY2025 20-F names EPAM Systems among its primary “next-generation digital IT service providers” — a peer set it separates from traditional consultancies and offshore IT firms — and flags the emergence of “software engineering agents” as a new competitive threat both firms face.
The market for technology and IT services is intensely competitive, highly fragmented and subject to rapid change and evolving industry standards and we expect competition to intensify. […] Our primary competitors include next-generation digital IT service providers, such as Globant S.A., EPAM Systems, Grid Dynamics and Thoughtworks, digital agencies and consulting companies, such as Ideo, McKinsey & Company and Publicis Sapient, global consulting and traditional IT services companies, such as Accenture PLC, Capgemini SE, Cognizant Technology Solutions Corporation and Tata Consultancy Services Limited, and in-house development by our clients of their technology and IT capabilities. […] In particular, in the past 12 months, there has been the emergence of sophisticated “software engineering agents” that could be used to undertake work that we currently undertake for our clients.
p. 23 · Read in context →
Endava's self-description — “next-generation technology services” delivered with an “AI-native approach” across the full digital-transformation lifecycle — mirrors EPAM's own platform-engineering framing.
We are a leading provider of next-generation technology services, dedicated to enabling our clients to accelerate growth, tackle complex challenges and thrive in evolving markets. By combining innovative technologies and deep industry expertise with an AI-native approach, we consult and partner with our clients to create solutions that drive transformation, augment intelligence and deliver lasting impact. From ideation to production, we support our clients with tailor-made solutions at every stage of their digital transformation, regardless of industry, region or scale.
p. 53 · Read in context →
Endava's CEO ties its “AI-native engineering” go-to-market pivot to a Mastercard partnership in next-generation payments — an industry-vertical, partner-led AI play of the kind EPAM also pursues.
John Cotterell (Chief Executive Officer): As part of our go-to-market pivot, we expanded our strategic partner network enlarging our market reach and solution set.
I want to highlight our recently announced collaboration with Mastercard which combines Endava's AI-native engineering and industry expertise with Mastercard's global reach and data-driven products and services. Together, we believe we have a powerful engine to accelerate the adoption and scale of next-generation payments and immersive experiences for Endava's clients worldwide.
p. 8 · Read in context →
Globant S.A. (GLOB)
Globant is a digitally-native, “AI-first” engineering-services firm competing head-to-head with EPAM for digital-transformation and GenAI build work; its FY2025 annual report lists EPAM Systems by name as a competitor.
Globant's FY2025 annual report lists EPAM Systems, Inc. by name among the technology-service providers it competes with, alongside the traditional consultancies and other next-gen engineering firms.
We compete with various technology service providers such as Accenture, Atos, Capgemini, Cognizant Technology Solutions, Deloitte Digital, DXC Technology, Endava, EPAM Systems, Inc., Genpact, GlobalLogic, Grid Dynamics, HCL Technologies, Infosys, Tata Consultancy Services, CI&T and Wipro, among others. Additionally, we compete with numerous smaller local companies in the various geographic markets in which we operate.
p. 38 · Read in context →
Globant's stated AI mix — over a thousand GenAI/CoreAI/data engagements, roughly a third of its projects, plus 900+ AI-readiness projects in the pipeline — sizes the AI-first demand pool it and EPAM both chase.
Martín Migoya (Co-Founder & CEO): The share of clients we have identified as 100 square potential as part of our total bookings is currently 56.7%, up from 50% last year. Today, we have over a thousand engagements related to GenAI, CoreAI, or data currently running, representing a third of our overall projects. […] We have over 900 projects related to AI readiness in our pipeline. The new offering of AI pods, a departure from traditional consulting engaging models, has nearly doubled in its share of our pipeline.
p. 6 · Read in context →
Grid Dynamics Holdings, Inc. (GDYN)
Grid Dynamics is an enterprise-AI and platform-engineering firm with a CEE/Latin America/India delivery footprint closely resembling EPAM's; its FY2025 10-K names EPAM Systems as a primary competitor.
Grid Dynamics' FY2025 10-K names EPAM Systems, Inc. among its primary competitors and frames the contest around low-cost delivery geographies (India, China, CEE, Latin America) that EPAM also relies on.
We face competition from offshore IT services providers in outsourcing destinations with low wage costs such as India, China, CEE countries and Latin America, as well as competition from large, global consulting and outsourcing firms and in-house IT departments of large corporations. […] Our primary competitors include global consulting and traditional IT service providers such as Accenture plc, EPAM Systems, Inc., Capgemini SE, Cognizant Technology Solutions Corporation, Infosys Technologies, Tata Consultancy Services Limited,
p. 33 · Read in context →
Grid Dynamics' CEO reports AI at 29.3% of revenue and argues “headcount leverage is no longer a competitive moat,” pitching a “product-centric engineering” model over headcount-led incumbents — the same argument EPAM makes against legacy integrators.
Leonard Livschitz (Chief Executive Officer): Our first quarter results support that conviction with AI revenue reaching 29.3% of total company revenue, growing nearly 60% year over-year. […] Large enterprises are increasingly seeking highly capable, nimble partners like Grid Dynamics, who can move quickly and deliver meaningful AI outcomes rather than relying on incumbent global system integrators burdened by legacy delivery models. In many ways, headcount leverage is no longer a competitive moat and differentiation comes from domain knowledge, AI capabilities and ability to rapidly scale relevant expertise. […] We're not a systems integrator. We're a product-centric engineering company focused on solving the most complex mission-critical challenges for Fortune 1000 clients with a deliberate emphasis on driving revenue-generating capabilities, not just cost optimization.
p. 1 · Read in context →
Grid Dynamics defines itself as an “Enterprise AI transformation partner for the Fortune 1000,” built on data/ML, cloud and product engineering delivered from the Americas, Europe and India — the same remit and geography as EPAM.
Grid Dynamics Holdings, Inc. (“Grid Dynamics,” the “Company,” “we,” “us,” or “our”) is an Enterprise Artificial Intelligence (“AI”) transformation partner for the Fortune 1000. We combine deep AI expertise with proven enterprise-scale delivery to help clients identify where to invest in AI, deliver systems that work at scale, and capture real business value from AI deployments.
p. 7 · Read in context →
Cognizant Technology Solutions Corporation (CTSH)
Cognizant is a large global IT-services firm that competes with EPAM across digital, cloud and AI-enabled software work and names EPAM Systems by name as a direct competitor in its 10-K; its scale illustrates the size asymmetry EPAM faces.
Cognizant's FY2025 10-K lists EPAM Systems by name among its direct competitors in a market it describes as highly competitive and subject to rapid change.
Our direct competitors include, among others, Accenture, Atos, Capgemini, CGI, Deloitte Digital, DXC Technology, EPAM Systems, Genpact, HCL Technologies, IBM Consulting, Infosys Technologies, Tata Consultancy Services and Wipro. In addition, we compete with numerous smaller local companies in the various geographic markets in which we operate.
p. 18 · Read in context →
Cognizant's Flowsource platform — generative and agentic AI across the full software development life cycle, in use at over 70 clients — collides directly with EPAM's core digital platform engineering and GenAI-enabled delivery.
Ravi Kumar S (Chief Executive Officer): A primary tool for executing Vector 1 is our Flowsource platform, which integrates generative and agentic AI across the full software development life cycle. Flowsource is now being used at over 70 clients with an additional 120 in the pipeline.
p. 2 · Read in context →
Cognizant's FY2025 headcount of roughly 351,600 — heavily concentrated in India-based global delivery — marks the scale gap against EPAM's far smaller engineering base in the same delivery-model market.
As of December 31, 2025, we had approximately 351,600 employees, with 256,900 in India, 41,600 in North America, 14,600 in Continental Europe, 7,800 in the United Kingdom and 30,700 in various other locations throughout the rest of the world.
p. 19 · Read in context →
Accenture plc (ACN)
Accenture is the largest player in the digital-transformation and GenAI-services market EPAM competes in; it does not name EPAM, but its market-sizing and its integrated “reinvention services” model define the competitive backdrop and demand pool.
Accenture cites IDC's forecast that the advanced-AI market grows more than 40% through 2029, from roughly $20bn to over $70bn, and reports adding about 100 new advanced-AI clients per quarter — an outside sizing of the GenAI demand pool EPAM also targets.
Julie Sweet (Chair and Chief Executive Officer): IDC estimates that the total addressable market for advanced AI is expected to grow more than 40% through 2029, from roughly $20 billion today to over $70 billion. We are seeing a steady increase in demand, Over the last nine quarters, we've seen about 100 incremental clients initiate advanced AI projects with us each quarter
p. 16 · Read in context →
Accenture's description of its September 2025 “reinvention services” reorganization — one unit selling multi-service deals with AI and data embedded — is the integrated-delivery model EPAM competes against for large transformation mandates.
Julie Sweet (Chair and Chief Executive Officer): On September 1, we launched reinvention services, which brings all of Accenture's capabilities into a single unit. Nearly 80% of our large deals are multi-service. The model as we fully roll it out will make it faster and simpler to sell and deliver everything Accenture offers and to rotate our offerings to embed more AI and data and equip our people.
p. 8 · Read in context →
Infosys Limited (INFY)
Infosys is a large India-centric IT-services firm competing with EPAM for digital-transformation, cloud and GenAI engineering mandates; it does not name EPAM, but its Topaz/Cobalt platforms and AI-services push map onto EPAM's offering set.
Infosys sizes its AI-First framework at a US$300 billion opportunity and reports AI-led programs across 90% of its top-200 clients, AI-services revenue at 5.5% of the total, and over 325,000 employees being re-skilled on AI — an adoption-and-scale benchmark for EPAM's own AI positioning.
Infosys is emerging as a leader in AI services, with AI-led programs now deployed across 90% of our top 200 clients and rapidly scaling across industries.
Infosys is well-positioned as the leading company for AI services.
Our AI strategy is built on six core pillars of our AI-First value framework – strategy & engineering, data, process, legacy modernization, physical AI, and trust – together addressing a US$300 billion opportunity, based on market estimates. […] For Q3, we shared that our revenue from these six areas was 5.5% of our total revenue and growing at a significantly faster pace than the company. We are executing on our strategy of pivoting to AI services at speed. We have built strong partnerships with leading AI native companies and have a large base of employees trained on their foundation models. This is resulting in accelerated enterprise deployment helping our clients to unlock AI value at scale. Our focus is to continuously re-skill our over 3,25,000 employees on AI.
p. 19 · Read in context →
Infosys frames a “large addressable market for AI services” across six areas and positions its Topaz Fabric (AI) and Cobalt (cloud) platforms to serve it — the same digital, cloud and GenAI engineering demand EPAM pursues.
Salil Parekh (Chief Executive Officer and Managing Director): We see a large addressable market for AI services across six areas; AI strategy and engineering, data, process, legacy modernization, physical AI and trust. With our Topaz Fabric platform for AI, our Cobalt platform for cloud, we have differentiated capabilities to serve our clients across the six areas of AI.
p. 26 · Read in context →
More peer documents
Endava — FY2024 annual report (20-F) — FY2024 · 214 pages · Prior-year competition and business sections — confirms the EPAM-naming trendline and Endava's earlier next-gen-services framing. · Open →
Grid Dynamics — FY2024 10-K — FY2024 · 158 pages · Prior-year competitor list (also names EPAM, p29) plus the pre-“Enterprise AI” business description, for the strategy-repositioning trendline. · Open →
Globant — Q4 FY2025 earnings call — Q4 FY2025 · 40 pages · Fuller AI Pods rollout with token-subscription economics and the Salesforce/SAP/Oracle/Microsoft orchestration-layer positioning. · Open →
Accenture — FY2025 annual report (10-K) — FY2025 · 102 pages · Market description, services taxonomy and headcount for the scale/market backdrop behind the reinvention-services model. · Open →
Source: S&P Capital IQ consensus via Xpressfeed · Generated 2026-07-22.
Consensus for EPAM is being marked up on earnings even as the top line is trimmed: over the past 180 days FY2028 normalized EPS estimates rose about 7% while FY2028 revenue was cut roughly 5%, a margin-led upgrade. The company has beaten both revenue and normalized-EPS consensus in every one of the last eight quarters, with EPS the larger of the two surprises. Coverage stays deep through FY2027 but thins sharply in the outer years.
FY2028 EPS estimates up ~7% over 180 days as revenue is cut ~5%
FY2027 shows the same split — EPS higher, revenue lower over six months — while the last 30 days were essentially flat for both lines.
Currency: USD · Scale: money in millions, absolute · Point-in-time consensus; Δ90d is Now versus 90d.
| Metric | FY | 180d | 90d | 30d | Now | Δ90d |
|---|---|---|---|---|---|---|
| EPS (normalized) | FY2027 | $13.90 | $13.92 | $14.17 | $14.13 | +1.6% |
| EPS (normalized) | FY2028 | $14.32 | $15.17 | $15.29 | $15.26 | +0.6% |
| Revenue | FY2027 | $6.32bn | $6.20bn | $6.07bn | $6.05bn | -2.4% |
| Revenue | FY2028 | $6.77bn | $6.65bn | $6.46bn | $6.44bn | -3.1% |
Normalized EPS compounding faster than revenue through FY2028
Currency: USD · Scale: money in millions, absolute · YoY uses the prior fiscal year from the feed; analyst count and range use the first displayed period.
| Metric | FY2026E | FY2027E | FY2028E | YoY | Analysts | Low / high |
|---|---|---|---|---|---|---|
| Revenue | $5.72bn | $6.05bn | $6.44bn | +4.9% | 19 | $5.67bn / $5.77bn |
| EPS (normalized) | $13.05 | $14.13 | $15.26 | +13.4% | 19 | $12.82 / $13.15 |
Eight straight quarters beating both revenue and EPS consensus
Normalized-EPS surprises have generally run larger than revenue surprises, consistent with sandbagged earnings guidance rather than fair-value guiding.
Current sequences by metric: Revenue: 8 consecutive beats; EPS (normalized): 8 consecutive beats.
Currency: USD · Scale: money in millions, absolute · Consensus is captured before each actual first became effective.
| Quarter | Metric | Consensus | Actual | Surprise | Outcome |
|---|---|---|---|---|---|
| Q1 FY2026 | Revenue | $1.39bn | $1.40bn | +0.4% | Beat |
| Q1 FY2026 | EPS (normalized) | $2.75 | $2.86 | +3.8% | Beat |
| Q4 FY2025 | Revenue | $1.39bn | $1.41bn | +1.2% | Beat |
| Q4 FY2025 | EPS (normalized) | $3.16 | $3.26 | +3.2% | Beat |
| Q3 FY2025 | Revenue | $1.38bn | $1.39bn | +1.4% | Beat |
| Q3 FY2025 | EPS (normalized) | $3.03 | $3.08 | +1.7% | Beat |
| Q2 FY2025 | Revenue | $1.33bn | $1.35bn | +1.5% | Beat |
| Q2 FY2025 | EPS (normalized) | $2.61 | $2.77 | +6.0% | Beat |
| Q1 FY2025 | Revenue | $1.28bn | $1.30bn | +1.5% | Beat |
| Q1 FY2025 | EPS (normalized) | $2.27 | $2.41 | +6.1% | Beat |
| Q4 FY2024 | Revenue | $1.21bn | $1.25bn | +2.9% | Beat |
| Q4 FY2024 | EPS (normalized) | $2.75 | $2.84 | +3.1% | Beat |
| Q3 FY2024 | Revenue | $1.15bn | $1.17bn | +1.4% | Beat |
| Q3 FY2024 | EPS (normalized) | $2.70 | $3.12 | +15.6% | Beat |
| Q2 FY2024 | Revenue | $1.14bn | $1.15bn | +0.6% | Beat |
| Q2 FY2024 | EPS (normalized) | $2.26 | $2.45 | +8.5% | Beat |
Analysts split on outer-year earnings: FY2028 EPS spans $13.86–$16.55
The FY2027 band is tighter and rests on 19 analysts; FY2028's wider range reflects both real disagreement and fewer contributors, and a single analyst covers FY2029.
Currency: USD · Scale: money in millions, absolute · Spread/mean is absolute high-low divided by absolute mean.
| Metric | Period | Mean | Low–high | Spread/mean | Analysts |
|---|---|---|---|---|---|
| EPS (normalized) | FY2027E | $14.13 | $13.08–$14.72 | 11.6% | 19 |
| EPS (normalized) | FY2028E | $15.26 | $13.86–$16.55 | 17.6% | 11 |
Wide target spread ($83–$235) under a balanced buy/hold book
Currency: USD · Scale: money in millions, absolute · Analyst counts shown explicitly.
| Street view | Reading | Analysts |
|---|---|---|
| Recommendation mix | Buy 8, Outperform 3, Hold 8, Underperform 0, Sell 0 | 19 |
| Consensus score | 2.00 | 19 |
| Target price | mean $135.9; median $131.0; high $235.0; low $83.00 | 17 |
Visible Alpha broker models via S&P Xpressfeed · 16 brokers · 383 line items · freshest revision 2026-07-21.
EPAM's broker models describe an IT-services business climbing out of a growth trough: organic constant-currency growth bottoms near 3% in FY-2026 before reaccelerating toward 6% by FY-2028, lifting revenue from about $5.4bn to $6.5bn. Consensus on the headline P&L is unusually tight, with 15-16 brokers clustered within a point on operating income, so the modeled debate lives in the mix: which verticals and geographies lead, and how fast the fixed-price contract shift plays out. The differentiated operating detail here (billed rates, utilization, headcount) is real but thin, resting on one to two brokers.
Financial services anchors the mix; Emerging and Software & Hi-tech grow fastest
| Line | FY-2025A | FY-2026E | FY-2027E | FY-2028E | YoY | Brokers |
|---|---|---|---|---|---|---|
| Vertical | — | — | — | — | — | — |
| Total revenues | $5.44bn | $5.72bn | $6.05bn | $6.46bn | +5.2% | 16 |
| Total revenue - Financial services | $1.28bn | $1.40bn | $1.45bn | $1.64bn | +9.3% | 8 |
| Total revenue - Travel & consumer | $1.07bn | $1.09bn | $1.19bn | $1.23bn | +2.1% | 8 |
| Total revenue - Emerging | $932.42m | $973.35m | $1.04bn | $1.14bn | +4.4% | 8 |
| Total revenue - Software & Hi-tech | $814.43m | $913.84m | $950.76m | $969.53m | +12.2% | 8 |
| Total revenue - Business information & Media | $684.31m | $675.62m | $706.72m | $743.74m | -1.3% | 8 |
| Total revenue - Life sciences & healthcare | $639.46m | $664.09m | $698.15m | $739.86m | +3.9% | 8 |
Europe is out-growing North America across the forecast
| Line | FY-2025A | FY-2026E | FY-2027E | FY-2028E | YoY | Brokers |
|---|---|---|---|---|---|---|
| Geography | — | — | — | — | — | — |
| Total revenue - North America | $3.23bn | $3.28bn | $3.47bn | $3.72bn | +1.5% | 8 |
| Total revenue - Europe | $2.14bn | $2.33bn | $2.45bn | $2.61bn | +8.8% | 8 |
| Total revenue - APAC | $110.60m | $100.62m | $106.67m | $117.92m | -9.0% | 8 |
The modeled growth trough is FY-2026, with reacceleration after
Organic constant-currency growth is modeled at ~4% in FY-2025 and ~3% in FY-2026, then reaccelerates to ~5% and ~6% in FY-2027 and FY-2028; reported constant-currency and total growth trace the same V. It rests on only four to five brokers, so read it as direction, not precision.
Modeled growth is priced, not staffed: billed rates rise while utilization holds
Billed rate per hour climbs from about $61 to $68 while utilization holds near 77% and net IT-professional additions slow from ~3,080 in FY-2025 toward ~1,200 a year. These labor lines are one- to two-broker views.
| Line | FY-2025A | FY-2026E | FY-2027E | FY-2028E | YoY | Brokers |
|---|---|---|---|---|---|---|
| Unit economics | — | — | — | — | — | — |
| IT professionals(#) | 58,179 Number | 58,380 Number | 59,580 Number | 60,830 Number | +0.3% | 2 |
| Billed rate/Hour - IT professionals($) | $61.02 | $63.19 | $65.25 | $68.05 | +3.6% | 2 |
| Utilization rate(%) | 77.2% | 76.7% | 77.3% | 77.3% | -0.5pt | 2 |
| Headcount - Net Additions - IT professionals(#) | 3,079 Number | 1,780 Number | 1,200 Number | 1,250 Number | -42.2% | 2 |
Brokers split on the pace of the fixed-price contract mix shift
The shift from time-and-materials toward fixed-price, outcome-based delivery is economically material for margins, and the models disagree sharply on its FY-2027 pace - far wider than the tight consensus on any single vertical.
| Line | Period | Median | Q1–Q3 | Min–max | Brokers |
|---|---|---|---|---|---|
| Total revenue - Fixed price | FY-2027E | $1.06bn | $804.21m–$1.34bn | $788.44m–$1.44bn | 4 |
The differentiated lines rest on thin, slightly older coverage
The headline P&L carries 15-16 brokers refreshed within the last day, but the operating KPIs, contract mix, and client-concentration lines that make this feed distinctive rest on one to four brokers, several of them single-analyst and last revised in May-June 2026. Treat those lines as directional.
Headline P&L consensus, momentum and beat/miss live in the CapIQ tab.
Source: S&P Capital IQ transcripts via Xpressfeed · latest indexed call 2026-05-07 · generated 2026-07-22.
Latest call digest
EPAM Systems, Inc., Q1 2026 Earnings Call, May 07, 2026 · 2026-05-07T12:00:00
Q1 2026 call — May 7, 2026. Prepared remarks led with strength: revenue at the high end of the outlook (up 7.6% year-over-year), the first year-over-year gross-margin improvement in some time, AI-native revenue above $125 million (up ~20% sequentially, a fifth straight quarter of double-digit sequential growth), and a new multiyear applied-AI partnership with Anthropic. Management reiterated the >$600 million AI-native target for 2026.
The Q&A reality was more guarded. Alongside the upbeat AI narrative, Jason Peterson lowered the full-year revenue growth outlook to 4%–6.5% (from 4.5%–7.5%), citing Middle East uncertainty, higher energy prices, and underperformance in North America that has reduced second-half visibility. The stated case for the implied second-half reacceleration rests on roughly ten unusually large, non-T&M vendor-consolidation and transformation deals that management is risk-adjusting heavily and only partially reflecting in the guide. Analysts pressed repeatedly on whether that pipeline can backfill existing-client softness, whether the midpoint holds if the large deals slip, and how tokenomics reshapes pricing and margins. Guidance actually stated: FY revenue growth 4%–6.5% (2.5%–5% organic constant currency), non-GAAP EPS $12.98–$13.28; Q2 revenue $1.4–$1.415 billion (~4% growth at midpoint).
Participant coverage from the latest call.
| Group | Participants | Count |
|---|---|---|
| Management | Operator; Mike Rowshandel — Head of Investor Relations, EPAM Systems, Inc.; Balazs Fejes — President, CEO & Director, EPAM Systems, Inc.; Jason Peterson — Senior VP, CFO & Treasurer, EPAM Systems, Inc. | 4 |
| Analysts | Bryan Bergin — MD & Analyst, TD Cowen, Research Division; Margaret Nolan — Partner & Research Analyst of Technology, Media, and Communications, William Blair & Company L.L.C., Research Division; Jason Kupferberg — Managing Director & Senior Equity Analyst, Wells Fargo Securities, LLC, Research Division; James Friedman — Senior Analyst, Susquehanna Financial Group, LLLP, Research Division; David Grossman — Managing Director, Stifel, Nicolaus & Company, Incorporated, Research Division; Yu Lee — MD of Equity Research & Senior Equity Analyst, Guggenheim Securities, LLC, Research Division; James Schneider — Senior Research Analyst, Goldman Sachs Group, Inc., Research Division; Bryan Keane — Research Analyst, Citigroup Inc., Research Division; Arvind Ramnani — Managing Director, Truist Securities, Inc., Research Division; James Faucette — MD & Equity Analyst, Morgan Stanley, Research Division | 10 |
Curated latest-call exchanges; one row per analyst topic.
| Analyst | Firm | Topic | What changed in Q&A |
|---|---|---|---|
| Bryan Bergin | TD Cowen | Nature of the guide cut and 2H confidence | Asked whether the reduction reflects a handful of slower large engagements or a broader portfolio dynamic, and what underpins the implied second-half sequential step-up. Management: a handful of customers delaying decisions since April/May; no assumed geopolitical improvement. |
| Margaret Nolan | William Blair | Broadening of client weakness; margin bridge | Pressed whether the full-year range assumes weakness spreads beyond the affected subset. Management tied the low end to broadening delays; flagged travel/consumer softness versus continued Financial Services and Hi-Tech demand. |
| Jason Kupferberg | Wells Fargo | Back-half sequential shape and large deals in the guide | Sought the base case for Q3/Q4 growth and clarity on the vendor-consolidation deals. Management: ~10 outsized non-T&M opportunities, only a small risk-adjusted subset embedded in guidance. |
| David Grossman | Stifel | Low/mid/high framing; North America weakness | Asked what drives each end of the range and whether the midpoint holds if large deals keep slipping. Management: midpoint rests on steady execution, not on winning the large deals; North America is where incremental weakness sits and where EMEA-style go-to-market investment is being directed. |
| Yu Lee | Guggenheim | Ability to close/execute unusually large deals; NEORIS | Questioned whether EPAM has the sales muscle, governance and delivery infrastructure for deals above its historical norm. Management acknowledged this is why the pipeline is risk-adjusted; noted AI-native portfolio runs above corporate-average profitability. NEORIS client described as stabilized. |
| James Schneider | Goldman Sachs | Large-deal margin profile; capital allocation | Asked whether converting large deals pressures margins and about buyback-versus-M&A priorities. Management expects continued year-over-year gross-margin improvement despite transition costs; buybacks continue with possible renewed M&A focus later in the year. |
| Bryan Keane | Citi | Contract pricing, tokenomics and Anthropic revenue model | Asked how pricing has shifted and how Anthropic revenue is recognized. Management: clients mostly bear token costs today; commercial models still evolving; notably reported securing rate increases for a small minority of clients rather than rate compression. |
| Arvind Ramnani | Truist | Confidence in pipeline conversion; AI cannibalization | Pointedly asked why prospective pipeline will convert on time after existing-client softness was under-anticipated. Management leaned on Middle East surprise and a modest required win share. Also acknowledged some budget shift and SDLC automation displacing legacy work. |
| James Faucette | Morgan Stanley | Tokenomics margin levers; M&A appetite | Asked what levers control margin on token-heavy, longer-duration work. Management described model-blending and multi-sourcing tokens 'akin to a trading desk'; reiterated possible M&A later in the year with a private-versus-public valuation gap. |
Theme tracker
Themes are curator-classified across supplied calls.
| Theme | Status | Quarters mentioned | Read-through |
|---|---|---|---|
| AI-native / GenAI revenue | persisted | Q2 2023, Q4 2023, Q4 2024, Q2 2025, Q3 2025, Q4 2025, Q1 2026 | Began in 2023 as positioning with management cautioning it was not yet material revenue; first quantified around $50M in Q4 2024, above $105M by Q4 2025, and above $125M in Q1 2026, with a reiterated >$600M 2026 target. The clearest sustained growth story in the history. |
| Macro caution and delayed client decision-making | persisted | Q2 2023, Q4 2023, Q1 2024, Q2 2024, Q4 2025, Q1 2026 | Present in nearly every call: acute demand softness through 2023-2024, easing during 2025, then re-emerging late 2025 and into Q1 2026 around larger discretionary programs. A recurring backdrop rather than a one-off. |
| Middle East / geopolitical uncertainty as a demand factor | emerged | Q4 2025, Q1 2026 | Distinct from the long-running Ukraine delivery topic, management newly cited Middle East uncertainty and higher energy prices as reasons some clients are delaying decisions, and made it central to the Q1 2026 guidance cut. |
| AI-enabled vendor consolidation and outsized deals | emerged | Q4 2025, Q1 2026 | Evolved from earlier 'clients returning to quality' commentary into roughly ten multiyear, non-T&M deals larger than EPAM's historical norm. Management presents these as a step-change but keeps them heavily risk-adjusted in guidance. |
| India mix-shift bill-rate / margin headwind | dropped | Q1 2024, Q2 2024, Q3 2024, Q4 2024 | A dominant, repeatedly-pressed pressure point through 2024 (sized around a ~$100M / ~200bps revenue drag). It has effectively disappeared from the narrative by 2025-2026 as attention shifted to AI economics. |
| Tokenomics and evolving commercial models | emerged | Q4 2025, Q1 2026 | A genuinely new construct: management describes clients currently bearing token costs, ongoing experimentation with pricing, and model-blending/multi-sourcing as future margin levers. Still unresolved by management's own account. |
Guidance ledger
Quotes, calls, and speakers are source-verified; outcomes are curator-classified.
| Verbatim guidance | Call | Speaker | Curator outcome | Outcome note |
|---|---|---|---|---|
| “For Q1 of 2026, we expect revenue to be in the range of $1.385 billion to $1.4 billion, producing year-over-year growth of 7% at the midpoint of the range.” | EPAM Systems, Inc., Q4 2025 Earnings Call, Feb 19, 2026 · 2026-02-19T13:00:00 | Jason Peterson | kept | Q1 2026 revenue came in at $1.4 billion, at the high end of the outlook, up 7.6% year-over-year. |
| “Revenue growth will be in the range of 4.5% to 7.5%.” | EPAM Systems, Inc., Q4 2025 Earnings Call, Feb 19, 2026 · 2026-02-19T13:00:00 | Jason Peterson | pending | Lowered to 4% to 6.5% on the Q1 2026 call, citing Middle East uncertainty, higher energy prices and North America underperformance; the full year is not yet complete. |
| “we continue to see robust demand for our AI-native services and expect to scale these revenues in excess of $600 million in 2026.” | EPAM Systems, Inc., Q4 2025 Earnings Call, Feb 19, 2026 · 2026-02-19T13:00:00 | Balazs Fejes | pending | Q1 2026 AI-native revenue exceeded $125 million, up nearly 20% sequentially; management reiterated the $600 million full-year target and cited a strong line of sight. |
| “we are committed to running the business at a profitability level of at least 15% for non-GAAP adjusted IFO.” | EPAM Systems, Inc., Q1 2024 Earnings Call, May 09, 2024 · 2024-05-09T12:00:00 | Jason Peterson | kept | On the Q4 2024 call management stated full-year 2024 adjusted income from operations of about 16.5%, above the at-least-15% commitment. |
| “Revenue growth will be in the range of 1% to 4%, on both a reported and constant currency basis.” | EPAM Systems, Inc., Q4 2023 Earnings Call, Feb 15, 2024 · 2024-02-15T13:00:00 | Jason Peterson | missed | The initial FY2024 growth target was walked down through the year; by the Q3 2024 call full-year revenue was guided to roughly flat year-over-year. |
Q&A pressure map
Question counts and firms are curator tallies; analyst coverage shown above.
| Topic | Questions | Firms | Pressure / response |
|---|---|---|---|
| Second-half visibility and credibility of the lowered guide | 5 | TD Cowen, Wells Fargo, Stifel, Truist | The dominant line of questioning on the Q1 2026 call. Analysts probed what backfills existing-client softness, whether the implied 2H reacceleration is achievable, and whether the midpoint holds if large deals slip. Management leaned on a risk-adjusted pipeline rather than committed backlog, and said the midpoint does not depend on winning the large deals. |
| AI pricing, tokenomics and cannibalization | 4 | Citi, Truist, Morgan Stanley | Repeated questions on how token economics reshapes pricing, whether AI displaces legacy revenue, and how margin is controlled on token-heavy work. Management acknowledged some budget shift and SDLC automation while describing model-blending and multi-sourcing as levers. |
| Outsized vendor-consolidation deals — size, execution and margins | 3 | Wells Fargo, Guggenheim, Goldman Sachs | Analysts questioned whether EPAM has the sales, governance and delivery capacity for deals above its historical norm and how their margins compare. Management conceded uncertainty on timing and ramp, which is why the pipeline is risk-adjusted. |
| North America softness and go-to-market investment | 2 | William Blair, Stifel | Questions focused on whether weakness broadens and why North America is simultaneously the weak spot and the target of new EMEA-style go-to-market investment. Management framed the investment as personnel, process and marketing change, not a demand call. |
Language shifts
Only language evidence verified against the referenced component is shown.
| Observation | Verbatim evidence | Call ID | Component |
|---|---|---|---|
| The most explicit confidence reversal in the history: management labeled its own prior second-half-2024 recovery assumption a misjudgment, setting the low point of the cycle. | “This view, which we now believe was optimistic” | 1877759691 | 2 |
| After a broadly more upbeat 2025, caution vocabulary returned as management reintroduced decision-making slowness at the start of 2026. | “we are seeing some slowness in decision making at the start of 2026 as clients finalize budgets” | 1978782779 | 3 |
| A new, specific risk vocabulary entered the Q1 2026 call, with the Middle East named as a direct driver of client behavior rather than generic macro caution. | “we are seeing the ongoing uncertainty in the Middle East begin to have an impact on client decision-making” | 1993788992 | 3 |
| Management explicitly stepped down its confidence versus the prior quarter, an unusual direct acknowledgment of reduced visibility. | “there's a more macro uncertainty today compared to 90 days ago” | 1993788992 | 2 |
The call history frames a company mid-pivot: a genuine, quantified AI-native growth story layered on a traditional book that remains macro-sensitive. The recurring pattern of confident guidance followed by mid-year revisions (2024 most starkly, and again with the Q1 2026 cut) argues for weighting the risk-adjusted second-half pipeline conservatively, while the durability of AI-native sequential growth and returning gross-margin improvement are the clearest positives to track.
EPAM Systems: a fallen growth star
EPAM Systems is a debt-free, cash-generative software-engineering firm whose shares have fallen roughly 88% from their 2021 peak — first when Russia's 2022 invasion of Ukraine put a delivery base concentrated in Eastern Europe at risk overnight, then through a multi-year IT-services slowdown and, more recently, fears that AI will compress demand for the coding work it sells. The business kept growing and rebuilt its delivery engine around India; the multiple did not follow. This report assesses which of those two facts proves durable.
What EPAM does
EPAM sells software engineering. It builds and modernizes digital products, platforms, cloud systems and, increasingly, AI-enabled applications for large enterprises, billing mostly for the time of its engineers on long-running client programs [1]. Founded in 1993 and headquartered in Newtown, Pennsylvania, it employed approximately 62,850 people at the end of 2025, up from 61,200 a year earlier, delivering from centers across the Americas, Europe and Asia [2]. Since 1 September 2025 it has been led by CEO Balazs Fejes, with founder Arkadiy Dobkin moving to Executive Chair after two decades as chief executive [3].
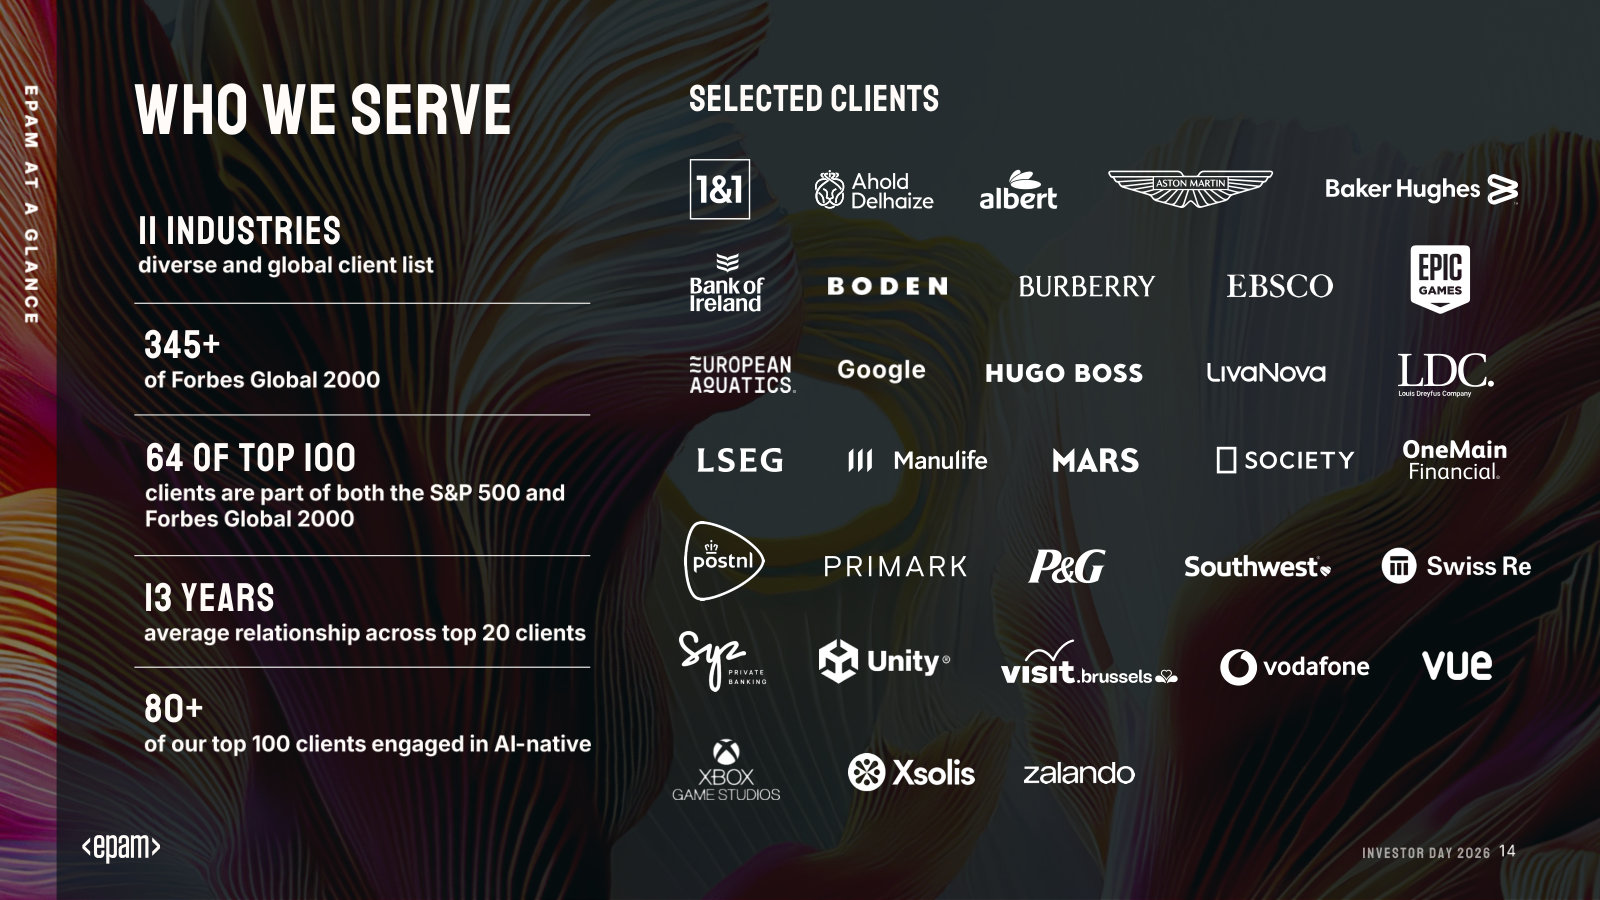
The revenue base is diversified by client and by end-market, which matters for a services firm whose only real asset is billable people. In 2025 the Americas segment produced 58.7% of revenue and EMEA 39.3% [4], with financial services the single largest vertical at $1.3 billion, or 24% of revenue [5]. Client concentration is low — the top five clients were 13.7% of revenue and the top ten 21.6% in 2025 — and relationships are long: 64.4% of revenue came from clients that had used EPAM for at least five years [6].
Sources: FY2025 Annual Report (Form 10-K), MD&A revenue by segment [7] and by industry vertical [8].
What happened to the stock
EPAM was a genuine market darling. Revenue compounded from about $1.2 billion in 2016 to $3.8 billion in 2021, and the shares tracked it, reaching an all-time-high close of $717 on 8 November 2021 — roughly 88 times that year's diluted earnings of $8.15. They closed at $86.38 on 13 July 2026, and touched a 52-week low of about $76 in June 2026. That is a decline of about 88% from the peak.
Source: daily price history as reported; the 2026 point is the 13 July 2026 close.
The fall came in two distinct legs. The first was abrupt: the shares roughly halved in 2022, from $668 at the end of 2021 to $328, when the invasion of Ukraine put a delivery base then concentrated in Ukraine, Belarus and Russia at risk overnight. The second leg was a slow grind — $328 to $86 across 2023 to mid-2026 — driven by a soft IT-services spending cycle and, most sharply in the first half of 2026, by anxiety that generative AI will erode demand for the software-development labor EPAM sells. The two legs have different causes, and the chapters that follow weigh each separately — the cyclical and geopolitical markdown against any permanent impairment.
Why bankruptcy is not the risk here
For a de-rated name, the first question is usually survival. For EPAM it is quickly answered. The company carries essentially no financial debt — $25 million of long-term obligations at the end of 2025, largely leases — against $1.30 billion of cash [9]. Net cash is therefore about $1.3 billion. The business has generated positive free cash flow consistently, including $655 million of operating cash flow and $613 million of free cash flow in 2025 [10].
Cash (FY2025, $M)
Total Debt ($M)
Net Cash ($M)
FY2025 Free Cash Flow ($M)
Sources: FY2025 Annual Report (Form 10-K), Consolidated Balance Sheets [11] and Consolidated Statements of Cash Flows [12].
A net-cash, cash-generative services firm with no lenders to answer to is close to the opposite of a bankruptcy candidate. Whatever else this report finds, financial distress is not the bear case; the debate is about growth, margins and relevance.
How the economics moved
The through-line of the numbers is that revenue held up and even resumed growing, while profitability slipped. Revenue reached $5.46 billion in 2025, up about 15%, but much of that increase came from the late-2024 acquisitions of NEORIS and First Derivative rather than from organic demand [13]. GAAP operating margin fell from 14.4% in 2021 to 9.5% in 2025, and net income in 2025, at $378 million, was below 2024's $455 million despite higher revenue [14].
Source: reported financials, FY2020–FY2025 Annual Reports (Form 10-K); operating margin derived from reported revenue and operating income [15].
The margin compression is the part that most deserves scrutiny. Some of it is cyclical — pricing and utilization weaken when clients defer projects — and some reflects the cost of rebuilding delivery capacity and absorbing acquisitions. Whether 9.5% is a trough or a new normal is one of this report's open questions; a dedicated financials chapter takes up the three-year detail and the forward estimates the reader asked for. One number to carry forward: 2025 GAAP EPS of $6.72 sits well below the $11.50 of adjusted (non-GAAP) EPS the company reported for the same year — a gap large enough to warrant its own examination [16].
The delivery base was rebuilt, not lost
The 2022 invasion was existential for the delivery model, not just the share price. EPAM had built its engineering strength in Ukraine, Belarus and Russia. Russia revenue alone fell from $165 million in 2021 to $73 million in 2022 and $16 million in 2023 as the company wound down and exited the country [17]. Four years on, India is EPAM's single largest delivery location, with about 12,200 professionals at the end of 2025, and Ukraine remains a meaningful hub [18]. That the company kept growing revenue while re-founding its labor base on a different continent is a point in favor of the "cyclical, not broken" reading.
Founder-led, but lightly owned
For an investor who prizes owner-operators, EPAM is a mixed case. Arkadiy Dobkin built the company over three decades and remains Executive Chair after handing the CEO role to Balazs Fejes in September 2025 [19]. But his economic stake is modest: 1,522,993 shares, or 2.9% of a company whose share count has fallen to 52.4 million as buybacks continued [20]. The founder's presence is real; the founder's skin in the game, measured in dollars, is not large. A later chapter on management and ownership tests what that means.
What the price now implies
At $86, EPAM's 52.4 million shares are worth about $4.5 billion. Strip out the roughly $1.3 billion of net cash and the operating business is valued near $3.3 billion — a little over five times its 2025 free cash flow, and under 13 times trailing GAAP earnings of $6.72 per share [21]. That is a fraction of the roughly 88-times earnings the market paid at the 2021 peak. On the company's own adjusted (non-GAAP) numbers the multiple looks cheaper still — about seven times the $13 of adjusted EPS analysts expect for 2026 — though that basis excludes stock compensation and other real costs, and is examined later. Consensus sits well above the tape: the mean analyst price target is about $139 against the $86 quote, with forecasts for mid-single-digit revenue growth into 2026–2027.
The central question of this report: whether EPAM's roughly 88% de-rating marks the permanent impairment of its digital-engineering franchise — its growth, its margins, and its relevance as AI reshapes software services — or the cyclical and geopolitical markdown of a debt-free, cash-generative business that has already rebuilt the delivery base the 2022 invasion destroyed.
The margin-of-safety pieces a value investor looks for are visibly present: a fallen former darling, a fortress balance sheet, a mid-single-digit cash-flow multiple, and no obvious path to insolvency. What is not yet settled — and what the chapters that follow examine — is whether the engine that made EPAM worth 88 times earnings still works well enough to be worth more than five times cash flow.
Financials and Estimates
EPAM's three-year record shows a business whose reported growth and reported earnings have moved in opposite directions. Revenue rose 15.4% in 2025 to $5.46 billion, yet GAAP net income fell 16.9% to $378 million and diluted EPS dropped from $7.84 to $6.72 [1]. Most of that gap is the mechanics of self-funded acquisitions, not core deterioration. This chapter lays out the numbers behind the divergence and what management and consensus expect next.
Revenue
▲ 15.4% YoY
GAAP Op. Margin
GAAP Diluted EPS
▼ -14.3% YoY
Non-GAAP Diluted EPS
▲ 5.9% YoY
Source: FY2025 Annual Report (Form 10-K), Consolidated Statements of Income [2]; Q4/FY2025 earnings release, non-GAAP reconciliation [3].
The three-year record
Reported revenue tells a story of renewed growth: $4.69 billion in 2023, $4.73 billion in 2024, and $5.46 billion in 2025 [4]. The step-up in 2025 is real, but its source matters: the year-over-year increase came primarily from the fourth-quarter-2024 acquisitions of NEORIS and First Derivative, which added 9.2 percentage points to reported growth, with currency adding a further 1.3 points [5].
Source: FY2021–FY2025 Annual Reports, Consolidated Statements of Income [6].
Profitability moved the other way. GAAP operating margin peaked at 14.4% in 2021 — a boom year with an unusually low 9.7% tax rate — and has since settled into a lower band, from 11.9% (2022) to 10.7% (2023), 11.5% (2024), and 9.5% in 2025 [7]. Net margin has compressed further, to 6.9% in 2025. The case is most sensitive to whether 9.5% is a cyclical trough or a structural reset; the year-by-year path below frames the question, and the section on 2026 guidance shows how management answers it.
Source: derived from reported financials, FY2021–FY2025 Annual Reports [8].
Why 2025 earnings fell as revenue rose
The 16.9% decline in GAAP net income — from $454.5 million to $377.7 million — is only partly an operating-margin story. Income from operations fell $24.6 million, held down by a surge in depreciation and amortization to $124.8 million from $89.6 million as acquired intangibles began amortizing [9]. The larger swing sat below the operating line. Interest and other income, net collapsed to $11.5 million from $46.9 million as EPAM spent down its cash pile on those same acquisitions, and the foreign-exchange loss widened to $25.9 million from $7.0 million [10].
Source: Q4/FY2025 earnings release, Consolidated Statements of Income; components computed from the same statement [11].
Read that way, roughly a third of the earnings decline is operating and two-thirds is the below-the-line cost of buying growth: lost interest income on cash converted into two businesses, plus a currency headwind. That distinction matters for the investment case, because foregone interest income and a one-year FX loss are not the same kind of problem as an eroding services margin.
Cash generation reinforces the point. Free cash flow of $613 million in 2025 exceeded GAAP net income by 62%, because the earnings figure absorbs large non-cash charges — $124.8 million of depreciation and amortization and roughly $177 million of stock-based compensation — that do not leave the business [12]. Operating cash flow rose 17% to $655 million even as reported profit fell. The balance sheet behind these flows — roughly $1.3 billion of net cash and negligible debt — is treated in Fallen Star.
Reported growth versus organic growth
Because acquisitions and currency drive so much of the reported line, the cleaner gauge of underlying demand is organic constant-currency growth, which strips both out. On that basis 2025 grew 4.9%, against 15.4% reported [13]. That split is the pivot of the valuation case: EPAM's operating business trades at roughly 5x free cash flow (enterprise value ~$3.3B on $613M of 2025 free cash flow), but ~$470M of the revenue that multiple capitalizes was just bought for $927M (62% of it goodwill) with net income since acquisition 'not material', and only 4.9% of 2025's 15.4% reported growth was organic constant-currency. The deal economics behind that figure — the goodwill share and the ~2x sales paid — are treated in Margin of Safety; here the split simply marks how much of the reported line is bought. The quarter-by-quarter path is the more useful signal for the organic base: organic growth troughed near 1% in late 2024 and re-accelerated through 2025.
Sources: quarterly earnings calls — Q4 2024 [14], Q1 2025 [15], Q2 2025 [16], Q3 2025 [17]; Q4/FY2025 release [18].
Management attributes the improvement to a broad-based return to demand across all six verticals and all three regions, and to early traction in AI-related work; growth was positive in every vertical in 2025, led by Financial Services at 24.1% of revenue [19]. The counter-reading is that mid-single-digit organic growth is a long way from the 20%-plus rates EPAM posted before 2022, and that whether it holds — or is undercut by AI-driven pricing pressure — is unresolved. That debate is the subject of later chapters; the record here simply establishes that the organic base is growing again, not shrinking. Client concentration also stayed low, with the top five clients at 13.7% of revenue, down from 15.8% [20].
GAAP versus adjusted earnings
The gap flagged in Fallen Star — GAAP diluted EPS of $6.72 against non-GAAP diluted EPS of $11.50 — widened in 2025, and the direction of the two measures diverged. While GAAP net income fell 16.9%, non-GAAP net income rose to $646.8 million from $630.0 million, and non-GAAP EPS climbed to $11.50 from $10.86 [21]. The entire reported-earnings decline is a GAAP phenomenon; on the adjusted basis the company still grew.
Sources: FY2024–FY2025 actuals and FY2026 guidance midpoint, Q4/FY2025 earnings release non-GAAP reconciliation [22]; FY2026 guidance [23].
What sits inside the $311.5 million of adjustments to operating income deserves a closer look, because not all of it is the same quality. The largest single item is stock-based compensation of about $177 million — a genuine, recurring economic cost of a talent business, and the piece a skeptic would refuse to add back. Amortization of acquired intangibles more than doubled, to $71.4 million, and is non-cash but reflects real capital deployed on acquisitions. Cost-optimization (restructuring) charges of $47.9 million are labelled non-recurring, yet EPAM has run such a program in 2023, 2024, and again in 2025, which makes the "one-time" characterization generous [24]. Ukraine humanitarian support of $14.6 million is the most defensibly one-off.
Source: Q4/FY2025 earnings release, non-GAAP adjustment detail; stock comp combines cost-of-revenue and SG&A components [25].
A conservative investor should treat stock-based compensation as a true cost. Deducting the full $177 million from the adjusted figure still leaves earnings well above the GAAP number, so the two measures bracket a range rather than one being simply right: GAAP understates cash economics through non-cash amortization, while the adjusted figure flatters the multiple by adding back genuine, recurring compensation. The honest read of the year is that operating earnings power held roughly flat while the acquisition machinery and currency pushed the headline GAAP number down.
What the estimates and guidance imply
Management's own 2026 guidance answers the trough-or-reset question directly. It calls for GAAP operating margin to recover to 10.0%–11.0% from 9.5%, GAAP diluted EPS of $7.95–$8.25 (a roughly 20% rebound from $6.72), and non-GAAP diluted EPS of $12.60–$12.90 [26]. Revenue growth is guided to 4.5%–7.5%, of which organic constant currency is 3.0%–6.0%, with essentially no further acquisition contribution and a modest currency drag [27]. In other words, 2026 is guided as a self-help margin-recovery year on organically-driven growth, not another acquisition-fuelled top line.
Sources: FY2025 actuals and FY2026 company guidance, Q4/FY2025 earnings release [28] [29]; FY2026 consensus per aggregated analyst estimates.
Consensus sits at the optimistic end of that frame. Nineteen analysts model 2026 revenue of about $5.73 billion (5.0% growth) and non-GAAP EPS of $13.05, just above the top of the company's own guidance range, rising to $14.15 on $6.06 billion of revenue in 2027. Current-year EPS estimates have been revised up by 16 analysts and down by none over the past 30 days — a positive-revision trend, though 2027 estimates are more mixed. The visible expectation, then, is a return to steady high-single-digit adjusted-EPS growth on mid-single-digit revenue growth, with per-share figures further supported by the buyback that reduced diluted shares to 56.2 million in 2025 from 58.0 million [30].
The wide range of price targets captures how contested that outlook is. Against a current price of $86.38, the 19 published targets run from $85 at the low to $235 at the high, with a mean of $139 and a median of $135; the rating split is three strong-buy, eight buy, eight hold, and no sells. The implied multiples are undemanding on the estimates that hold up — roughly 10.7 times the midpoint of 2026 GAAP EPS guidance, and about 6.6 times consensus 2026 non-GAAP EPS — but those multiples are only as good as the mid-single-digit organic growth and margin recovery the estimates assume. The valuation lens itself belongs to Fallen Star and later chapters; the estimates simply mark where the debate is priced.
Source: aggregated analyst estimates and price targets (19 analysts); current price as of mid-July 2026.
The numbers here set up the chapters that follow: the top line is growing again organically, cash generation is intact, and the GAAP earnings dip is largely acquisition mechanics — but the margin recovery and the durability of organic growth are assumptions, not facts.
AI Demand and Deflation
Artificial intelligence is at once EPAM's largest source of new demand and the most direct threat to what it actually sells — billable engineering hours. The company has scaled a defined "AI-native" revenue line to a target above $600M for 2026 and now calls itself a "pure-play AI-native" firm, while its own 10-K warns that AI could force price concessions and says the fear has "negatively impacted the price of our stock" [1]. On the evidence to date the tailwind is winning at the top line; the pricing threat is real but not yet visible in the operating numbers.
This is the assumption underneath every estimate in the Financials and Estimates chapter: the estimates are most sensitive to which side of AI proves larger, and to whether that leaves mid-single-digit organic growth a floor or a ceiling.
The risk, in the company's own words
The threat is not analyst conjecture; EPAM has been escalating it in its filings for two years. Generative AI did not appear as a demand-and-pricing risk in the FY2021 or FY2022 10-Ks at all. It entered with the FY2023 filing, which warned that clients "may be unwilling to pay rates for human delivery personnel if they perceive that the same services can be performed by" AI, and that the technology "could disrupt … our ability to charge for their services" [2]. That first appearance coincides with the second leg of the share-price decline traced in Fallen Star.
By the FY2025 10-K the language had hardened into a dedicated section — "Risks Related to Artificial Intelligence" — with a sub-heading that states the fear plainly: "Increased Adoption of AI-Based Software Tools May Reduce Demand for Our Services." The filing concedes that clients "may seek other service providers or expect price concessions" if comparable work can be done "less expensively using AI," and, unusually for risk-factor boilerplate, admits the market has already reacted: competition from "AI-based task-specific tools … has negatively impacted the price of our stock" [3].
The mechanism is specific to EPAM's model. It bills largely on a time-and-materials basis: revenue is roughly hours multiplied by rate. If AI makes an engineer materially more productive, the same deliverable takes fewer hours, and under an unchanged pricing model that saving flows to the client, not to EPAM. The company gave a live example this year: at consumer-finance client Nelnet, its AI tooling drove a "31% productivity increase" and "nearly 2x" faster back-end development [4]. Delivered under pure T&M, a 31% productivity gain is a 31% headwind to the revenue on that scope.
The tailwind EPAM is selling against it
Management's answer is that AI enlarges the pie faster than it deflates the per-hour price. At its March 2026 Investor Day, EPAM framed a total AI-spending market of $4.7 trillion by 2029, growing at a roughly 30% compound rate, and defined its own addressable "AI Services" slice at about $1.3 trillion [5]. The thesis, repeated across recent calls, is that AI raises enterprise complexity and technical debt faster than it removes work — that "the build opportunity is a long-term win" as the backlog of required modernization becomes more evident, not less [6].
Unlike most tailwind stories, this one now carries a revenue line. EPAM reports a "pure AI-native" revenue figure — defined narrowly as AI-native IP and platforms plus AI-led transformation programs, explicitly excluding ordinary work merely accelerated by AI tools. That figure exceeded $105M in the fourth quarter of 2025, and management guides it above $600M for 2026 [7]. Against consensus 2026 revenue near $5.73B, a $600M AI-native line is on the order of 10% of the company.
The scale of the ambition is easier to read as the two disclosed points and their share of the business:
Source: Q4 FY2025 earnings call, prepared remarks [8]. A Q4 quarterly figure and a full-year target are not directly comparable; shown as the two points management disclosed.
The demand signals behind the number are broad rather than one or two marquee deals. On the Q1 2026 call, EPAM said more than 80% of its top-100 clients are engaged in AI initiatives, that it launched over 100 new AI-native projects in the quarter, and that it sees "an escalating large-deal pipeline focused on AI-enabled vendor consolidations" — multiyear deals larger than its historical norm, whose "full potential … is not yet reflected in our outlook" [9]. The pivot has a history: the "AI/Run" delivery framework and "AI factory" construct date to late 2024 under then-CEO Arkadiy Dobkin [10], and have since been made the center of the strategy under CEO Balazs Fejes.
The deflation test in the numbers
If AI were already hollowing out a labor-based business, the tell would be revenue rising while headcount falls, or revenue per employee climbing sharply as machines replace juniors. EPAM's disclosures show neither yet. Total employees fell to 53,150 in 2023 during the post-invasion contraction, then grew to 61,200 in 2024 and 62,850 in 2025 [11]. Revenue per employee has been range-bound, not deflating.
Source: employee counts from FY2025 10-K, Human Capital [12]; revenue per employee derived from reported revenue and year-end headcount, FY2022–FY2025. Reported revenue includes acquisitions, which lift the 2025 figure.
The read is genuinely two-sided and worth stating carefully. That headcount is still rising cuts against the crude "AI replaces the engineers" bear case — as of end-2025 there is no evidence in the workforce data that AI is shrinking the labor model. But the flat-to-modest revenue per employee also means AI has not yet delivered the productivity leverage the bull case needs; the 2025 uptick is partly the higher-value NEORIS and First Derivative acquisitions rather than organic mix. And management is explicit that the commercial model is mid-transition. On the Q1 2026 call, Fejes described "a generally new and consequential commercial construct," said the company will "evolve our approach to AI investment pricing … for some quarters to come," and pointed to a deliberate shift toward "new fixed-price and other service deals" and outcome-based models — the mechanism by which a services firm keeps a share of the productivity gain rather than handing all of it back [13]. Whether that repricing holds is not something the numbers can yet answer.
The whole industry is in the same bind
EPAM is not facing a company-specific disruption; every services peer is managing the same tension, which is a useful check on how EPAM is positioned. The clearest statement of the pricing dilemma came from Globant's CEO Martín Migoya, asked how "AI Pods" — a token-based, "more work with tokens and less with humans" model then at roughly $21M of annualized recurring revenue, under 1% of revenue — avoid cannibalizing seat-based revenue: "I am not in a position to prevent cannibalization. So I want that transformation to happen" [14]. The instinct across the group is the same: lead the cannibalization rather than be a victim of it.
Scale, though, separates the field, and here EPAM is a credible specialist rather than a leader. Accenture — the closest large-cap comparator named repeatedly in EPAM's own competitive framing — reported "Advanced AI" bookings of $2.2B in a single quarter (Q1 FY2026), nearly double a year earlier [15]. Cognizant said it had crossed $10B of cumulative AI-led large-deal starts, including $1.2B in one quarter [16]. EPAM's disclosed AI figure — a $600M revenue target, not a bookings tally — is proportionally meaningful to a company its size but an order of magnitude smaller in absolute terms.
Sources: Accenture Q1 FY2026 call [17]; Cognizant Q4 FY2025 call [18]; EPAM Q4 FY2025 call [19]; Globant Q4 FY2025 call [20]. Each firm defines and measures its "AI" line differently — bookings versus revenue versus recurring revenue — so the figures rank scale, not like-for-like performance.
The honest conclusion from the peer set is that EPAM's "pure-play AI-native" branding is a positioning choice, not a demonstrated share lead. Its edge, if it has one, is depth: independent validation this year included a Gartner Leader placement in generative-AI consulting and a top-five ranking for its AIRON developer agent on the SWE-bench software-engineering benchmark [21]. Whether premium engineering depth outcompetes the raw scale of Accenture and the India majors is a moat question this chapter does not settle.
The calibrated read
The weight of the evidence is that, so far, AI is adding more to EPAM's demand than it is subtracting from its pricing: a defined AI-native revenue line scaling toward roughly a tenth of the company, broad client engagement, and organic growth that re-accelerated to 5.6% by the fourth quarter of 2025 [22] rather than collapsing as a pure-deflation thesis would predict.
The strongest fact against that read is that the pricing risk is structurally real and largely unpriced by EPAM itself: the company is still delivering 31% client productivity gains under a commercial model it admits is only mid-transition [23], and its Q1 2026 outlook already flagged softer North America demand and "lower visibility in the second half" as clients defer larger discretionary programs [24]. The AI-native figures are also company-defined and unaudited, and the deflation could arrive with a lag — showing up in bill rates and margins before it shows up in headcount.
What would change the read in either direction is concrete and near-term: whether the AI-native line actually clears $600M in 2026 with stable or better margin (tailwind confirmed), or whether revenue per employee and organic growth stall even as the AI-native line grows (deflation winning, the top line masking a mix shift). The margin path is where the two forces will first collide — the subject the Financials and Estimates chapter leaves open.
Demand by Vertical
EPAM sells into five named industry verticals plus a growing "Emerging" group, and it discloses growth in each every quarter. Across a decade, that disclosure shows the slowdown is not uniform: Financial Services has become the largest vertical at 24.1% of revenue and is growing organically at a double-digit pace, while Business Information & Media and, in the United States, Software & Hi-Tech have stalled. EPAM's demand weakness is concentrated, not broad — the distinction that separates a cyclical markdown from structural impairment.
Financial Services Revenue (FY2025, $M)
FS Share of Revenue
Business Info & Media, FY23–FY25
Sources: FY2025 Annual Report (Form 10-K), Revenues by Vertical [1]; Business Information & Media change derived from FY2023 and FY2025 10-K vertical tables [2].
EPAM tells its buyers apart by industry, not just geography. A "substantial majority" of clients sit in five verticals — Financial Services; Software & Hi-Tech; Business Information & Media; Consumer Goods, Retail & Travel; and Life Sciences & Healthcare — with everything else, from energy to telecom to industrial materials, filed under Emerging Verticals [3]. That concentration is itself a stated risk: a downturn in any one of the five would pull revenue with it [4]. It is also the lens the other chapters skip: the financials and the moat work view EPAM by segment (Americas, Europe) and by total; the demand story lives one level down, in which industries are spending.
The mix has shifted
Source: derived from reported financials, FY2020–FY2025 10-K Revenues by Vertical tables [5]; [6].
Two lines move against the pack. Financial Services rose from roughly 21% of revenue in 2020 to 24.1% in 2025 and is now clearly the largest book [7]. Emerging Verticals — energy, manufacturing, telecom and industrial materials — climbed from about 11% to 17.2%, part organic and part acquired [8]. Against them, Business Information & Media fell from around 21% of revenue in 2020 to 12.4%, and Software & Hi-Tech drifted from roughly 19% to 15%. The company that IPO'd as a technology-and-media engineering shop now earns most of its keep from banks, insurers and industrial clients.
Who grew, who stagnated
Share shifts can flatter or mislead when the base is moving, so the cleaner test is absolute dollars. Using FY2023 — the first full year after the Russia exit — as the base removes the wind-down distortion and isolates who has actually added revenue since.
Source: FY2023 and FY2025 10-K Revenues by Vertical tables [9]; [10].
Group revenue rose 16.3% over the two years, but the growth is lopsided. Financial Services (+29.3%), Emerging Verticals (+45.2%) and Life Sciences & Healthcare (+27.7%) carried it; Software & Hi-Tech added 16.1%; Consumer, Retail & Travel was flat (+0.4%); and Business Information & Media shrank 10.4% in absolute terms while everything around it grew.
The honest caveat is that FY2025's headline vertical growth is inflated by the two late-2024 acquisitions and by currency: management attributes 9.2 points of the year's 15.4% total growth to the first-year contribution of NEORIS and First Derivative, and another 1.3 points to foreign exchange [11]. First Derivative is a capital-markets consultancy, so it lands almost entirely in Financial Services; the filing says the vertical's 16.1% Americas gain "benefit[ed] from new revenues from clients gained through our 2024 acquisitions," as did Emerging Verticals' 29.3% Americas jump, which came "due to revenues from our fourth quarter 2024 acquisitions of NEORIS and First Derivative" [12]; the Europe book's 41.8% gain drew on the same acquired clients [13]. Strip the acquired revenue out — as the organic-growth work does at the group level — and the FY2025 vertical picture is far more muted than the bars suggest.
The clean organic signal
Because both acquisitions closed by December 2024, the first-quarter 2026 year-over-year vertical growth is essentially organic — both periods already include NEORIS and First Derivative. That is the cleanest read the corpus offers on where demand is actually turning, and EPAM reports it separately for its two operating segments.
Source: Q1 FY2026 Quarterly Report (Form 10-Q), Americas and Europe segment vertical tables [14]; [15].
Financial Services is the one vertical growing at a double-digit organic rate in both geographies — up 10.8% in the Americas on "a large wealth management client and growth in fintech, insurance, and payment processing clients," and 12.2% in Europe on asset-management and insurance demand [16] [17]. Consumer, Retail & Travel grew in both regions (6.6% and 7.7%), a recovery off the cyclical trough of FY2024, when the vertical declined 5.7% in Europe on weak retail and consumer-goods demand [18].
The soft spots sit in the Americas. Software & Hi-Tech fell 2.1% in the US on "lower spend from our technology clients," and Emerging Verticals fell 3.1% [19]. Europe's 43.2% Software & Hi-Tech jump reads dramatic but the filing pins it to "increased demand at a large hardware client and several technology services clients" — one account, not a broad tech re-acceleration [20]. Business Information & Media was the only vertical to decline outright in Europe (down 7.2%), extending a multi-year fade [21].
Cyclical drag, structural fade
The demand map splits EPAM's soft verticals into two kinds of weakness, and the distinction is what the impairment-versus-cycle question turns on at the client level.
Consumer, Retail & Travel is the cyclical one: discretionary corporate spend that fell 5.7% in Europe in FY2024 and is now growing 6–8% again as retail budgets thaw [22] [23]. Business Information & Media looks structural: down roughly a quarter as a share of revenue since 2020 and shrinking in absolute dollars, as media and publishing clients consolidate and cut discretionary engineering [24]. Software & Hi-Tech sits between the two — flat-to-soft in the US, where EPAM's technology clients are the most capable of building their own AI tooling in-house, the self-cannibalization risk the AI chapter frames.
On balance, the vertical data supports the cyclical reading over the impairment one: the drag is localized in a discretionary vertical that is already recovering and in a structurally fading media book that is now only 12% of revenue, while the largest and fastest-growing vertical — Financial Services, a quarter of the company — is expanding organically at double digits across both regions. The strongest fact against that read is that Financial Services' recent prominence was bought as much as earned: First Derivative's capital-markets revenue lifted the vertical's reported growth well above its organic rate, so the "healthiest vertical" is partly an acquisition that the valuation work still books as an unproven return. What would change the read is a second consecutive quarter of organic decline in US Software & Hi-Tech, or Financial Services organic growth slipping toward the group average once the acquired base fully anniversaries — either would move the weakness from a couple of nameable verticals toward the whole book.
Moat and Peers
EPAM sells itself as a premium engineering firm, and exactly one number backs that claim: revenue per employee near Accenture's and well above the offshore majors. Everywhere else the premium disappears. Its GAAP operating margin (9.5%) and returns on equity (10.3%) sit in the lower half of a six-name peer set, below Accenture, Cognizant and Infosys. The durable evidence of a moat is narrower than the reputation: clients stayed through the loss of EPAM's entire Eastern-European delivery base.
How defensible the franchise actually is decides whether the de-rating is a permanent impairment or a cyclical markdown.
The field EPAM names for itself
EPAM does not have to be told who it competes with; it lists them. Its 10-K names Accenture, Atos, Capgemini, Cognizant, Deloitte Digital, DXC, Endava, Genpact, GlobalLogic, Globant, Grid Dynamics, HCL, Infosys, Tata Consultancy Services and Wipro [1], and it defines the competitive factors as technical expertise, industry knowledge, on-time delivery, recruiting and retention, scale, financial stability and price [2]. It stakes its differentiation on "complex and innovative software product development solutions," a technical employee base, and the ability to "deliver end-to-end AI-native solutions" [3].
That framing — engineering-led, not staff-augmentation — is testable. A firm doing harder work than its rivals should earn either a higher price per head, a higher margin, or higher returns. EPAM earns the first and not the other two.
Where the premium is real: revenue per head
EPAM ran 62,850 employees at the end of 2025, of which about 56,600 were delivery professionals [4]. Against $5.46 billion of revenue, that is roughly $87,000 of revenue per employee — near Accenture's ~$89,000 (779,000 people against $69.7 billion) [5] and well above Cognizant's ~$60,000 (351,600 employees against $21.1 billion) [6]. The offshore-heavy India majors sit lower still.
Source: derived from reported FY2025 revenue and disclosed headcount — EPAM 10-K [7]; Accenture 10-K [8]; Cognizant 10-K [9].
The comparison is imperfect: the India majors run a wider pyramid of lower-cost junior staff, which depresses their revenue per head without depressing their profitability. But the signal survives the caveat. On price-per-person, EPAM clusters with Accenture at the top of the field, not with the volume outsourcers. Its clients are paying for harder work.
Where it isn't: margins and returns
That pricing does not reach the bottom line. On GAAP operating margin, EPAM's 9.5% in FY2025 is the second-lowest of the group — barely ahead of Globant (9.4%), and far behind Accenture (14.7%) and Cognizant (16.1%).
Source: derived from FY2025 filings — EPAM 10-K MD&A [10]; Accenture 10-K income statement [11]; Cognizant 10-K income statement [12]. Infosys reports in rupees and is shown in the table below.
The same ordering holds on returns. Two adjustments are owed to EPAM here, and they matter. First, its GAAP margin is depressed by stock-based compensation (~$177 million, roughly 3.2% of revenue) and acquired-intangible amortization; on the non-GAAP basis the company reports, operating margin runs near 15% (Margin Bridge), closer to Accenture and Cognizant — though those peers also carry stock comp. Second, EPAM's return on equity is dragged down by a balance sheet still holding ~$1.3 billion of net cash, capital that Accenture and Infosys return rather than park. Even allowing for both, the picture is a firm whose economics are ordinary against the leaders and whose returns rank near the bottom.
Sources: derived from most-recent-fiscal-year filings (fiscal years end Aug 2025 for Accenture, Mar 2025 for Infosys, Dec 2025 for the rest; Infosys revenue converted from ₹1,629.9bn at ~₹83.5/$) — EPAM 10-K [13]; Accenture 10-K [14]; Cognizant 10-K [15].
The reason the premium price does not become premium profit is where EPAM once had its edge. Its differentiation was built on high-calibre engineers in Central and Eastern Europe, priced below Western consultancies but above commodity outsourcers. Two forces have compressed that arbitrage. The war pushed delivery into India and Latin America — the same geographies the majors already own — and EPAM's own filing warns that emerging-market wages "have increased and will make us less competitive if we are not able to increase the efficiency and productivity of our people" [16]. The talent-cost gap that funded the margin is narrowing toward the field.
Growth: fast, but not the fastest
EPAM's filings and calls lean on a claim of superior organic growth. The peer data does not clearly support it. Its FY2025 reported revenue grew 15.4%, but only 4.9% of that was organic constant-currency (Financials and Estimates); the rest was the NEORIS and First Derivative acquisitions. On a like-for-like basis that ~5% is roughly where Accenture (7.4% reported) and Cognizant (7.0%) landed, and behind Infosys and the fast-reaccelerating small-cap Grid Dynamics (17.5%). Over three years the ordering is starker: EPAM's revenue compounded at 4.2%, matching Accenture and beating Cognizant, but trailing Globant (11.3%), Infosys (10.3%) and Grid Dynamics (9.9%). EPAM is a mid-pack organic grower whose ~$912 million of acquisitions lifted reported growth above its organic rate.
The AI-scale gap
The most direct test of franchise durability now is AI, and here EPAM is a credible specialist rather than a leader. It guides its defined "AI-native" revenue above $600 million for all of 2026 (AI Demand and Deflation). Accenture booked $2.2 billion of advanced-AI work in a single quarter, "nearly doubling" year-over-year [17]. A firm competing on being the best engineer for the AI transition is being out-booked roughly fifteen-to-one by the largest generalist. Scale in this market compounds — more reference deployments, more data, more pricing leverage in vendor consolidations — and EPAM is on the wrong side of it.
Accenture books more advanced-AI work in one quarter ($2.2 billion) than EPAM targets in AI-native revenue for a full year (above $600 million). EPAM's positioning as a premium AI-native engineer is credible; its claim to be winning the category is not.
The moat test EPAM has already passed
The counter-evidence is real, and it is the most important fact in this chapter. In 2022 EPAM lost access to its entire Russia, Belarus and Ukraine delivery base — for years the majority of its engineers — effectively overnight, and had to "shift portions of our delivery capabilities to other countries" under active sanction and client pressure [18]. A commodity staffing arrangement does not survive that; the client relationships were rebuilt on new continents, and the business grew through it. That is switching-cost evidence a peer table cannot show — the work is embedded enough, and the teams trusted enough, that clients relocated with EPAM rather than replacing it. It sits alongside the low client concentration and long tenure established at the outset of this report (Fallen Star): a top-five that is 13.7% of revenue, and 64% of revenue from clients of five years or more.
So the moat exists, and it is specific: deep, sticky engineering relationships that hold through disruption. What the peer numbers say is that it is narrow, not wide — real enough to retain clients through catastrophe, not wide enough to command a margin or return premium, and being pressed on price by wage convergence and on scale by Accenture's AI scale.
What would change the read
On today's evidence the franchise is durable but not dominant — a narrow, contested moat rather than a permanently impaired or a widening one. Two developments would move that judgment. If EPAM's GAAP operating margin converges back toward the mid-teens while organic growth holds at mid-single digits — showing the premium price finally reaching profit as the delivery base stabilises — the cyclical-markdown reading gains ground. If instead AI-native revenue stalls below its $600 million target, or margins stay stuck near 9-10% through the FY2026 guide period, the case that the engineering edge has been competed away, on both cost and scale, gets harder to answer.
Where the Margin Went
EPAM's GAAP operating margin fell from 11.5% in 2024 to 9.5% in 2025 [1]. That drop is a cost-of-delivery event, not overhead bloat: cost of revenue rose from 69.3% to 71.2% of sales while SG&A actually fell as a share of revenue [2]. Acquisition dilution, a lapsed Poland tax credit, higher variable pay and currency did the damage. The company's own guidance puts margin back to 10–11% in 2026 [3] — a claim this chapter tests against the exit run-rate.
The two-point drop, decomposed
The move from an 11.5% to a 9.5% operating margin is worth about two points of revenue, or roughly $110 million. Almost all of it sits above SG&A. Gross margin — revenue less cost of delivery — narrowed 1.9 points, from 30.7% to 28.8%. Amortization and depreciation, swollen by intangibles from the late-2024 acquisitions, took another 0.4 points. Working the other way, SG&A leveraged down by about 0.3 points as revenue outgrew the sales-and-admin base.
Source: derived from FY2025 Annual Report (Form 10-K), MD&A results-of-operations table [4].
The bridge below isolates the three moving parts. Gross margin is the story; SG&A is a modest offset; amortization is the acquisition tail.
Source: derived from FY2025 Annual Report (Form 10-K), MD&A results-of-operations table; components sum to the reported 2.0-point decline [5].
What compressed the gross line
Management attributes the 1.9-point gross-margin fall to four named causes, and the mix matters because they age differently. First, the NEORIS and First Derivative acquisitions completed in late 2024 carry lower delivery profitability and were consolidated for a full year in 2025 [6]. Second, a $13.6 million cumulative Poland R&D tax credit that had inflated 2024's cost of revenue did not recur, so the year-over-year comparison is flattered on the base and penalised in 2025 [7]. Third, variable compensation rose with a stronger second half — a cost that tracks performance, not a leak [8]. Fourth, the appreciation of delivery-location currencies added about 0.8 points of unfavourable cost, partly offset by hedging [9].
The through-line running under all four: "compensation increases which we were not able to fully offset through pricing" [10]. That sentence has recurred across the record since 2024, when a promotion campaign lifted pay faster than bill rates [11]. It is the same wage-versus-price squeeze the moat chapter traced to the post-war shift of delivery into India and Latin America and to emerging-market wage inflation (Moat and Peers).
Two of the four causes are essentially non-recurring in nature — the Poland credit lapped clean, and a full year of acquisition consolidation is a one-time step in the base. The other two — wage inflation outrunning price, and currency — are the durable open questions, and they are where the AI thesis meets the income statement.
Utilization and pricing: no deflation in the numbers yet
If AI were already deflating EPAM's billable hours (AI Demand and Deflation), the tell would be falling bill rates and slumping utilization. Neither is visible. Utilization has held in a tight mid-70s band — 75.4% in Q4 2025, 77.0% in Q1 2026 [12] — with the modest recent dip explained by holiday timing and the deliberate intake of junior staff who ramp at lower initial utilization [13].
Pricing, if anything, turned the right way late in the period. The CFO described "slightly better pricing" through the second half of 2025 [14] and confirmed outright "rate increases in Q1" 2026 that "helped profitability" [15]. That is the opposite of the deflation bear case, at least so far: the pricing pressure that compressed 2024–25 gross margin was wage-led, not AI-led, and it was easing as 2026 opened. The counter is that AI-driven price deflation, when it comes, would show up here first — so the absence of it in 2025 data is reassuring about the present, not dispositive about the thesis.
The quarterly rebuild, and whether the guide is credible
The full-year 9.5% understates where the business exited 2025. Operating margin bottomed at 7.6% in the seasonally weak first quarter — payroll-tax caps reset in January and fewer billable days — then rebuilt each quarter to 10.6% by Q4. The first quarter of 2026 fell back to 8.3%, the same January seasonality repeating.
Source: quarterly income statements, FY2025 10-Qs and Q4 2025 release; FY2026 guide of 10–11% GAAP operating income [16].
This reframes the credibility question. The 10–11% FY2026 guide is not a promised recovery from a 9.5% base; it roughly annualises the 10.4–10.6% run-rate the company was already printing in the third and fourth quarters of 2025 [17]. Management framed 2026 as "committed to improving overall profitability, and specifically gross margin," with the CFO expecting year-over-year gross-margin improvement in the first half [18], [19]. That is a lower bar than the full-year 2025 optic implies.
The bar is not free, though. The guide leans on the same second-half-weighted seasonality repeating, and 2026 opened with softer demand: in May 2026 the company cut its full-year revenue-growth outlook to 4–6.5% from 4.5–7.5%, citing delayed client decisions and higher energy prices [20]. It held the 10–11% margin band while trimming the top line — meaning the margin now depends more on cost discipline than on volume leverage.
The "one-time" charges that keep arriving
That cost discipline has a recurring line item. EPAM has run a named "cost optimization program" — workforce reductions booked to SG&A — in each of the last three years, and the charges have grown, not faded: about $35 million in 2023, $31 million in 2024 and $48 million in 2025, with a further roughly $25 million flagged to complete the 2025 program by mid-2026 [21].
Source: FY2025 Annual Report (Form 10-K), Note 12 — Cost Optimization Programs; 2026 is the company's estimate of charges remaining to complete the 2025 program [22].
A charge that recurs every year for four years is, in substance, an operating cost of running the post-war delivery model — continuously re-shaping the workforce toward India and Latin America and out of higher-cost geographies. It is real cash. But note where it sits: in SG&A, the very line that leveraged down in 2025. So even carrying these charges, overhead is not the margin problem. The margin problem is gross, and it is largely acquisition mix and a lapsed tax credit — items that do not repeat at the same scale.
The GAAP-to-non-GAAP gap is structural, and rising
One reason EPAM's headline margin looks thin against peers is the size of the wedge between its GAAP and non-GAAP numbers. Non-GAAP operating margin was 15.2% in 2025 [23] — about 5.7 points above the 9.5% GAAP figure. The wedge is stock-based compensation (about 3.2% of revenue and growing, $147.7M in 2023 to $176.8M in 2025) [24], amortization of acquired intangibles ($71.4M), and the restructuring above.
The cleanest read on delivery economics strips both corporate stock comp and acquired-intangible amortization: EPAM's own segment operating profit — revenue less delivery cost, SG&A and depreciation, before those unallocated items — was $855.1 million in 2025, or 15.7% of revenue, down from $825.6 million and 17.5% in 2024 [25]. Two points there: the compression is real even before any GAAP adjustment noise — the delivery margin genuinely fell about 1.8 points — but at 15.7% that pre-corporate margin sits close to Accenture's 15.6% reported operating margin, which reframes the "bottom-of-peer" GAAP optic from the moat chapter as substantially a stock-comp-and-amortization difference rather than a delivery-quality one (Moat and Peers).
The read
The evidence points to a cyclical-and-mix margin trough rather than a structural reset. The 2025 compression is concentrated in the gross line, and its largest single drivers — a full year of lower-margin acquisitions and a lapsed Poland tax credit — are step-changes in the base, not a deteriorating run-rate. Utilization is stable, pricing turned positive into 2026, and the business exited 2025 at a 10.4–10.6% quarterly margin that already sits inside the FY2026 guide. On those facts the 10–11% guide is credible.
The strongest fact against that read is the cost-optimization line: a "one-time" restructuring charge in its fourth consecutive year, escalating, is the tell of a delivery model that needs continuous re-shaping to hold its margin — and the guide now leans on that discipline because the top-line assumption was cut in May 2026. What would change the read: gross margin failing to improve year over year in the first half of 2026, against management's explicit commitment, or the cost-optimization charges continuing past the 2025 program's mid-2026 completion. Either would move the story from mix-driven trough toward structural reset.
Owners and Capital
EPAM is founder-led in spirit but institutionally owned in fact. Co-founder Arkadiy Dobkin holds 2.9% of the stock and the entire insider group 3.8%; four index and active managers hold more than a third [1]. Into an ~88% decline, insiders were net sellers, not buyers. The clearest vote of confidence has come not from their wallets but from the company's own cash: buybacks of roughly $1.2 billion across three years, retiring stock at falling prices.
Ownership: a founder with a small stake, and institutions in control
As of March 2026 there were 52,444,312 shares outstanding. The founder's holding is the largest inside the company but small in absolute terms, and it sits well below the stakes of the passive and active funds that dominate the register [2].
Source: 2026 Proxy Statement (DEF 14A), Security Ownership of Certain Beneficial Owners & Management [3].
This matters for how a reader frames the case. A company where a founder owns a controlling block and personally absorbs the drawdown is a different proposition from one where a professional management team stewards other people's capital. EPAM is the latter. Dobkin stepped back from the CEO role in 2025 — Balazs Fejes now runs the company, with Dobkin as Executive Chair — and no insider owns enough to steer an outcome the institutions oppose. The founder's stake has also drifted lower over time, from 4.4% in 2019 to 3.4% in 2022, 3.5% in 2024, and 2.9% today, as he sold, gifted, and had shares withheld for taxes on vesting [4] [5] [6].
Source: EPAM proxy statements, Security Ownership tables, 2019–2026 [7] [8] [9] [10].
No insider buying at the lows
For a reader drawn to insider alignment, the transaction record is the more telling test than the static stake. Across mid-2023 through mid-2026 — the period spanning the second leg of the decline — insiders sold roughly $33 million of stock in discretionary open-market sales and bought almost nothing: about $0.16 million, in small recurring lots that carry the signature of routine employee stock-purchase-plan participation rather than opportunistic buying [11]. Not one officer or director stepped in to buy the stock at its lows.
Source: derived from SEC Form 4 filings, June 2023–May 2026 [12].
The counter-fact matters, and it is favorable to management's timing. The single largest seller was Dobkin himself, who sold 39,300 shares for about $11.9 million — but he did so in March 2024, at $300 to $307 a share, near a local high, and has made no discretionary open-market sale since; his later dispositions are mechanical share-withholding on vesting and option exercises [13]. So the record is not one of executives dumping stock into a falling market. It is the milder but still relevant absence of the opposite signal: with the shares down to roughly a quarter of that 2024 level, no insider has treated them as a bargain worth adding to personally. The "insiders think it's cheap" leg of a value case is simply not present here.
Compensation: mostly equity, well-supported, with one quirk
Pay is structured the way a professional investor would want: heavily weighted to equity, split evenly between performance stock units and time-vested restricted stock, with no employment agreements (bar a Swiss-law requirement for Fejes), no golden parachutes, a clawback policy, and prohibitions on hedging or pledging the stock [14] [15]. Absolute levels are moderate for a $5.5 billion-revenue S&P 500 company. Shareholders agree: the 2025 say-on-pay vote drew roughly 94% support [16].
Source: 2026 Proxy Statement (DEF 14A), Summary Compensation Table [17].
The quirk sits in the top row. Dobkin, having handed over the CEO title in 2025, was still the highest-paid executive that year at $8.1 million — above the sitting CEO's $5.2 million [18]. An Executive Chair out-earning the CEO is worth flagging; it is not disqualifying, and it may reflect a transition year, but a reader tracking whether the succession is real should watch whether the gap narrows in 2026.
The pay ratio is a lens on the delivery model as much as on pay. The median EPAM employee earned $38,570 in 2025, and the CEO-to-median ratio was 186:1, down from 219:1 in 2024 [19] [20]. The low median reflects a workforce that is roughly 95% outside the United States — the offshore-heavy cost base that is the company's core economic advantage, and the same labor pool whose billable hours the AI-deflation debate (AI Demand and Deflation) is about.
Capital allocation: countercyclical buybacks, and one large bet
With no dividend, EPAM's capital-return story is entirely the buyback — and the buyback has grown as the stock has fallen. The company spent $164.9 million on repurchases in 2023, $398.0 million in 2024, and $660.6 million in 2025, retiring every share bought [21]. The average price paid fell from about $215 a share in 2024 to about $187 in 2025 as management leaned in at lower prices, and in October 2025 the board authorized a fresh $1.0 billion program, $776.5 million of which remained at year-end [22] [23].
Sources: FY2025 Annual Report (Form 10-K), Consolidated Statements of Cash Flows and Share Repurchases note [24] [25]; FY2023 acquisitions per FY2024 10-K [26].
Because buybacks have outrun the modest dilution from stock compensation, options, and the employee purchase plan, the share count has actually fallen — from 57.8 million at the end of 2023 to 54.3 million at the end of 2025 [15]. In 2025 alone repurchases of about $662 million exceeded free cash flow of roughly $613 million, so the company returned more than its cash generation for the year, drawing modestly on its balance sheet to do so [27].
Source: FY2025 Annual Report (Form 10-K), Consolidated Statements of Changes in Stockholders' Equity [15].
The other side of the ledger is the acquisition bet. In 2024 EPAM deployed about $912 million of cash on acquisitions — chiefly NEORIS and First Derivative — draining its cash pile from $2.04 billion to $1.29 billion in a single year [28]. That choice bought most of 2025's reported growth (the acquisitions added roughly nine points to a 15.4% headline), but it also converted an interest-earning cash balance into operating businesses — and the lost interest income was about two-thirds of the year's GAAP earnings decline (Financials and Estimates). So management ran two capital programs at once through the downturn: buying its own shares at depressed prices while spending nearly a billion dollars to bulk up organically-slow revenue with bought growth. The buyback is straightforwardly value-accretive at these multiples; the acquisitions are the item a skeptic should keep testing, because their margin and returns are what determine whether the cash was well spent — the deal economics (goodwill weighting, price paid relative to sales, and earnings contribution to date) are set out in Margin of Safety.
What this establishes
On the reader's alignment test, the honest read is mixed. Governance is clean and shareholder-responsive — even-handed pay, near-unanimous say-on-pay, a separated chair and CEO, a board that has been declassifying and stripping out supermajority provisions under stockholder pressure [29]. But the "strong owner-operator with skin in the game" pattern does not fit: the founder owns under 3% and is stepping back, the insider group owns under 4%, and nobody inside has bought the stock on the way down. The conviction on display is corporate, not personal — the balance sheet retiring 6% of the shares in three years. That is a real signal, but it is management spending shareholders' cash, not risking their own. The main risk to reading the buyback as smart countercyclical capital return is the parallel $912 million acquisition bet: if those businesses underperform, the same team will have spent the cash cushion at exactly the wrong time.
Margin of Safety
EPAM's operating business trades at roughly 5x free cash flow (enterprise value ~$3.3B on $613M of 2025 free cash flow), but ~$470M of the revenue that multiple capitalizes was just bought for $927M (62% of it goodwill) with net income since acquisition 'not material', and only 4.9% of 2025's 15.4% reported growth was organic constant-currency. Those figures come from the 2025 balance sheet and cash-flow statement [1] [2], the late-2024 acquisitions note, which booked $577 million of goodwill [3] [4] [5], and the organic-growth split set out in Financials and Estimates.
The stakes sit in the free-cash-flow base under every multiple in this chapter. The ~$3.3 billion enterprise value capitalizes a $613 million free-cash-flow base into which ~$470 million — about 9% of revenue — of just-bought, lower-margin revenue was folded. With the $927 million paid carved back out of that enterprise value, the organic core — which still throws off essentially all of the cash, since acquired net income was "not material" — is valued at closer to 3.8 times free cash flow, cheaper still. The downside is the mirror image: if the acquired books stay dilutive and the forward base erodes from 2025's $613 million toward the ~$558 million three-year average, the priced-for-decline scenarios already in this chapter set the range — about $141 a share if free cash flow holds flat, about $114 on a 3%-a-year decline, and about $59 at a distressed three-times floor, against today's $86. That is roughly a $27-a-share gap between the flat and declining cases and about $82 between the flat case and the floor. Cutting the other way, the two deals were struck at a defensible ~2x sales and management re-authorized a $1.0 billion buyback in October 2025 [6], so a clean integration makes 5x free cash flow cheap rather than value-destructive.
The chapters before this one built the pieces: a mid-single-digit organic grower (Financials and Estimates) with a narrow, contested moat (Moat and Peers) and a defensible path back to a 10–11% operating margin (Margin Bridge). This chapter prices them.
The acquisition bet inside the multiple
Part of why the cash cushion is smaller than it once was, and why the free-cash-flow base is worth scrutinizing, is a roughly $1 billion acquisition program executed in late 2024. EPAM bought NEORIS for $626.3 million on 1 November 2024 [7] and First Derivative for $300.7 million on 2 December 2024 [8], with about $74 million more across three smaller deals.
Source: FY2024 10-K acquisitions note — purchase prices, goodwill and intangibles [9]; annualized revenue derived from partial-period revenue of $53.7M (NEORIS, two months) and $12.2M (First Derivative, one month) [10].
Of the combined $927 million, $577 million was goodwill and $384 million was intangibles, chiefly acquired customer relationships [11]. Almost nothing was tangible. The deals brought in roughly $470 million of annualized revenue — the partial-period figures were $53.7 million for NEORIS over two months and $12.2 million for First Derivative over one [12] — so EPAM paid about two times revenue. The filing states that net income from the two businesses since acquisition "was not material" [13], consistent with the gross-margin dilution traced in Margin Bridge: these are lower-margin books than the group.
The bet has a double cost that bears directly on the valuation. It converted a fortress cash pile into a lower-margin revenue stream — cash that had been earning interest, income that fell from $46.9 million in 2024 to $11.5 million in 2025 as the balance was spent [14]. And NEORIS's largest client, in Mexico and exposed to U.S. tariffs, is shrinking, which management guides to subtract about a point from 2026 organic growth. Whether the roughly $1 billion earns its cost is unresolved: it turns on whether the acquired books lift margin as integration completes, or stay a drag. The valuation is most sensitive to that outcome: a good one makes five times free cash flow cheap; a poor one means EPAM traded a high-quality balance sheet for lower-quality revenue. Against it, management restarted buybacks with a new $1.0 billion authorization in October 2025 [15], redirecting cash to its own shares at these prices — the capital-allocation record examined in Owners and Capital.
What the market is paying
Enterprise Value ($M)
Source: enterprise value derived from ~52.4M shares at $86.38 (market data, as of July 2026) and net cash of $1,296.1M cash less ~$25M debt per the FY2025 10-K balance sheet [16]; FCF of $612.7M and operating income of $520.0M plus D&A of $124.8M per the FY2025 10-K [17] [18]; GAAP EPS $6.72; adjusted EPS estimates per consensus.
Net of the cash, the market is paying about $3.26 billion for the operating company. Against 2025 free cash flow of $613 million [19] that is 5.3 times, an 18.8% free-cash-flow yield on enterprise value. On EBITDA of $644.8 million — operating income of $520.0 million plus $124.8 million of depreciation and amortization [20] — the multiple is 5.1 times.
The GAAP price-to-earnings ratio of 12.9 times, on $6.72 of 2025 diluted EPS [21], sits between the cash-flow read and the number analysts actually use. On consensus 2026 adjusted EPS of $13.05 the forward multiple is 6.6 times, and on 2027's $14.15 it is 6.1 times. The gap between 12.9 times and 6.6 times is the GAAP-to-adjusted wedge examined in Financials and Estimates — mostly stock compensation and acquired-intangible amortization, costs a skeptic would not add back in full. The honest valuation therefore lives between the two: cheaper than 13 times GAAP earnings, dearer than 7 times a scrubbed adjusted number.
What five times cash flow implies
A cash-generative business worth five times its free cash flow is not being priced for stability. As a perpetuity, an 18.8% cash yield on enterprise value implies the market expects EPAM's operating free cash flow to decline, not hold.
Source: derived from 2025 free cash flow of $612.7M [22] and net cash of $1,271M [23], at a 10% discount rate; a Gordon-growth perpetuity on ~52.4M shares.
The arithmetic is a single-stage perpetuity: enterprise value equals free cash flow divided by the discount rate less the growth rate. At a 10% discount rate, the current $3.26 billion enterprise value solves to a perpetual free-cash-flow growth rate of about minus 8.8% a year. Across a range of discount rates the implied decline moves in a band — roughly minus 7% at a 12% rate, minus 11% at 8% — but every reasonable input has the market pricing the operating cash stream to erode steadily and permanently.
By the same arithmetic, a business whose free cash flow merely holds flat forever is worth about $141 a share on the same 10% rate — close to the $139 mean analyst target and to the level a no-growth assumption alone would justify. A business that grows free cash flow 3% a year is worth roughly $191. The current price is below even the value implied by a 3% annual decline in perpetuity ($114). That is the measure of how much pessimism is discounted: the price is consistent not with slow growth or a plateau, but with managed shrinkage.
Two cautions keep this from being a simple "cheap" call. First, the 2025 free-cash-flow base of $613 million ran at 1.62 times net income, helped by working capital, so a cleaner run-rate is lower; the three-year average is about $558 million, which lifts the implied-decline math only modestly (to roughly minus 7% at a 10% rate). Second, a single-stage perpetuity is a blunt instrument for a business whose margin and growth are both in motion — it is a lens on market expectations, not a target.
Where the safety is, and where it is thin
For an investor who demands a large margin of safety and a near-zero chance of a wipeout, EPAM clears the balance-sheet test cleanly. The company holds about $1.3 billion of cash against roughly $25 million of debt [24], and has produced positive free cash flow every year for a decade, including $382 million in 2022 as it relocated its entire Eastern-European delivery base. Net cash is about $24 a share — roughly 28% of the $86 price sitting in cash — and the operating business itself throws off more cash each year. Bankruptcy is not a plausible path here.
Source: derived from net cash of $1,271M [25] and 2025 free cash flow of $612.7M [26] on ~52.4M shares; the 3x multiple is an illustrative distressed case, not a forecast.
A downside case makes the floor concrete. Valuing the operating business at a distressed three times free cash flow — a multiple that itself assumes the cash stream is shrinking — and adding the net cash puts the shares at about $59. That is roughly a third below today's price, which is a genuine drawdown but a bounded one: the cash and a decade of positive free cash flow put a hard limit under the equity that a leveraged fallen star would not have.
Two things keep this from being the deep-value ideal of a stock trading near its net cash. Net cash is 28% of the market capitalization, not close to all of it — most of what a buyer pays is for the operating business, so the thesis rests on that business, not on a cash-close-to-price cushion. And the free-cash-flow base that anchors every multiple here is not bulletproof: if the margin recovery stalls or the revenue base erodes, forward free cash flow falls and the "five times" cheapens less than it appears.
What the market fears, and whether it is contained
The value framework that fits EPAM best is a strong-balance-sheet business the market fears — a fallen star at a low multiple. Whether the fear is contained to one part of the business decides how much the low multiple protects a buyer.
Here the honest answer is that it is not contained. The thing being discounted is that generative AI compresses the price of engineering labor — the mechanism laid out in AI Demand and Deflation. That is not a ring-fenced segment, a single bad contract, or one troubled division whose loss the rest of the company would survive. It is a risk to the time-and-materials model that generates most of EPAM's revenue. A buyer is not getting a sound core plus one feared appendage priced at zero; the feared variable runs through the whole book. That is what separates EPAM from the cleaner setup where a market misprices one isolable piece and leaves the durable remainder cheap.
Two facts cut the other way, and they matter. The feared deflation is not yet visible in the operating data: utilization held in the mid-70s through 2025, pricing turned positive into 2026, and headcount kept rising (Margin Bridge, AI Demand and Deflation) — so the market is discounting an expected mechanism, not a realized one. And the switching-cost moat proven by surviving the 2022 delivery-base loss (Moat and Peers) gives the revenue base more persistence than a pure-labor-arbitrage story would. The read that follows: the margin of safety is in the balance sheet and the demonstrated client stickiness, not in the multiple being attached to a ring-fenced fear. The price already discounts steady decline; the question is whether the business erodes at the pace the price implies, and the operating data through early 2026 does not yet show it.
What would change the read
The price implies free cash flow shrinking around 7–11% a year in perpetuity. A handful of falsifiable line items, checkable in the filings over the next several quarters, would confirm or break that:
The current price discounts a steady decline in free cash flow. Evidence that free cash flow instead holds — a stable-to-rising margin with mid-single-digit organic growth sustained — would make the multiple look like a mispricing rather than a fair discount.
Confirming the cheap read: GAAP operating margin holding in the 10–11% guided band; organic constant-currency growth staying mid-single-digit rather than fading; AI-native revenue reaching the roughly $600 million 2026 target without cannibalizing the base; and the "one-time" cost-optimization charges finally stopping after the 2025 program completes around mid-2026. Any of these sustains the free-cash-flow base that anchors the valuation.
Breaking it: a 2025 free-cash-flow figure that proves flattered by working capital and reverts toward $500 million or below; operating margin slipping under 9% as the wage-versus-price squeeze reasserts; the acquired NEORIS and First Derivative books staying dilutive; or the first hard evidence of AI-driven price deflation in utilization and bill rates. Each would validate the decline the market has already priced — and, unlike the balance sheet, none of them is protected by the cash.
What to Watch
EPAM's next scheduled read on the impairment-versus-cycle question lands on August 6, 2026, when it reports the second quarter. The company has beaten consensus EPS for eight straight quarters, yet its sharpest single-day drops came on quarters where it beat and cut the revenue-growth outlook — the metric the stock has tracked. A May guide reduction, removal from the S&P 500, and a fresh 52-week low leave the burden on a second-half re-acceleration that is pipelined but not yet contracted.
A beat wrapped in a cut
The first quarter of 2026, reported May 7, was in most respects a good print. Revenue of $1.4 billion grew 7.6% year-over-year, 3.7% on an organic constant-currency basis [1]. GAAP operating margin improved to 8.3% from 7.6%, gross margin rose to 27.7% from 26.9%, and non-GAAP diluted EPS of $2.86 beat the $2.75 consensus by 4% [2]. Pure AI-native revenue exceeded $125 million, up nearly 20% sequentially and the fifth consecutive quarter of double-digit sequential growth [3].
What the market took away was the guidance. Management lowered the full-year revenue-growth range to 4.0%–6.5% from the 4.5%–7.5% set only eleven weeks earlier, and organic constant-currency growth to 2.5%–5.0% from 3.0%–6.0%, citing North American underperformance, higher energy prices, and "lower visibility in the second half" [4] [5] [6]. The revealing detail sits alongside it: the same release raised the non-GAAP EPS range to $12.98–$13.28 from $12.60–$12.90, on a lower share count and tax rate [7] [8]. Growth down, earnings up — and the shares fell 7% over the following two sessions, then drifted to a 52-week low of $75.93 on June 24, another 17% below the post-print level.
Source: initial FY2026 outlook, Q4/FY2025 call [9]; revised outlook, Q1 2026 call [10].
Where the stock actually moves
The eight most recent reports make the mechanism plain. EPAM beat the EPS estimate every single time, by margins ranging from 1.7% to 15.6%. The one-day share reaction, however, bore almost no relation to the size of the beat — it tracked the growth outlook. The two worst days, −12.8% and −17.0%, both fell on February quarters where management set a full-year revenue guide the market judged light, despite in-line-to-better earnings. The two best days, +12.9% and +14.9%, came when EPAM paired a beat with a raised or reassuring outlook.
Source: reaction computed from the daily share-price series; EPS surprise vs consensus as reported. Reactions are not in the filings; the underlying results are in the respective quarterly calls.
Source: EPS surprise as reported vs consensus; one-day reaction derived from the daily price series.
The read here is narrow and well-evidenced: at this stage of EPAM's story the market prices the revenue-growth trajectory, not the quarter's earnings. A ninth consecutive EPS beat on August 6 would, on this record, do little on its own; what has moved the stock is whether the 4.0%–6.5% full-year revenue guide holds, rises, or is cut again. The counter-case is that expectations are now so reset — the shares trade below net cash plus a distressed multiple (Margin of Safety) — that even a modest guide could clear a very low bar.
The second-half math
The guide that matters is arithmetically back-half loaded. First-quarter organic growth was 3.7%; the Q2 guide implies 2.7% organic at the midpoint on reported revenue of $1.40–1.415 billion [11] [12]. With the first half tracking around 3% organic, the 2.5%–5.0% full-year organic range requires the second half to hold or re-accelerate.
Source: Q4 2025 organic growth [13]; Q1 2026 actual and Q2 2026 guide [14] [15].
Management was candid about what stands behind the second-half step-up. The softness is "more of a handful of customers where decision-making does seem to be somewhat delayed," seen in April and May, with the strength resting on "a pipeline of larger deal opportunities in the second half" of AI-enabled vendor consolidations that the company is "focused on converting" [16]. Crucially, EPAM is "not assuming we will win all of those opportunities" and captures only "a small subset" in the model [17], while the low end of the range "reflects the possibility of broader delay in client decisions" [18]. This is not a guide built on signed backlog; it is a risk-adjusted view of a pipeline, back-half weighted, into a demand environment management itself calls more uncertain than 90 days earlier. A separate, known drag compounds it: the largest client of the acquired NEORIS business, a Mexico-based group hit by tariffs, subtracts roughly one percentage point from 2026 organic growth [19].
What changed around the stock
Two developments since the May print altered the ownership backdrop without touching the fundamentals. On May 27, S&P Dow Jones Indices announced EPAM's removal from the S&P 500 and demotion to the S&P SmallCap 600, effective June 2, 2026 — a forced re-weighting by index funds and a loss of large-cap index visibility for a company that had been an S&P 500 member since 2021. Two days later, Jefferies downgraded the stock and cut its price target to $110 from $130. Both are as reported in market coverage; the index change post-dates the FY2025 10-K, which still describes EPAM as an S&P 500 member. Against a 52-week range of $75.93 to $221.40 and an all-time high of $725 in late 2021, the shares near $86 sit about 88% below peak — the through-line's starting fact, now carrying an index-status markdown on top of the operating one.
Positioning data that would normally sharpen a catalyst read is thin here: reported short interest and borrow-pressure series are unavailable in this dataset, so the usual squeeze-or-overhang overlay cannot be quantified. The consensus frame is clearer — a mean analyst target near $139 against the current $86 implies wide dispersion (targets run $85 to $235), and the recent Jefferies cut illustrates the direction of travel on the sell side even as the average target sits well above the price.
The falsifiable checklist
The impairment-versus-cycle question resolves not in one print but in a sequence of checkable line items, each with a threshold that would move the read. The nearest checkpoint is Q2 on August 6; the full-year markers settle across the Q3 call and the FY2026 10-K.
Source: Q1 2026 call for Q1 actuals, guidance, and assumptions [20] [21] [22]; FY2025 free-cash-flow base from the Q4/FY2025 call [23].
Three of these already lean constructive. AI-native revenue is running ahead of the pace the $600 million full-year target implies; gross margin is up year-over-year despite the demand wobble; and non-GAAP EPS guidance rose even as revenue guidance fell, evidence that the margin-repair path (Margin Bridge) is intact. The Q1 cash outflow of $54 million is seasonal — variable-comp payments and vendor timing — against a $655 million operating cash flow and $613 million free cash flow for full-year 2025 [24] [25], so the full-year conversion, not the first quarter, is the figure to hold to the ~$600 million base.
What leans the other way is the top line. The guide has now been cut once, on demand that management concedes could broaden, into deals it does not yet hold. Buybacks continue — 1.8 million shares for $264 million at $143.84 in Q1, well above today's price, with management signalling it may prioritise M&A again in the second half [26] [27] — so capital return is not the question. Growth is. Every quarter EPAM holds mid-single-digit organic growth with margins climbing back toward 10–11% narrows the case that its franchise is permanently impaired; a second guide cut on August 6 would give that case its first hard confirmation. The read changes on the sequence, and the first data point is two weeks out.