Annual Reports
EPAM Systems, Inc.'s annual reports contain management's most considered account of the business. These are the sections, passages and visual pages worth opening in the originals preserved in Sources.
EPAM Systems, Inc. — FY2025 Annual Report (Form 10-K) — FY2025
The latest 10-K — how EPAM runs its people and rebalanced delivery base, and the geopolitical and AI risks that most directly threaten it. · Open the full document →
Item 1. Business — p. 5 · Read the full section →
Management's own framing of what EPAM sells — software engineering plus consulting, now pivoting to end-to-end AI-native transformation.
Overview: from software-engineering roots to AI-enabled transformation and consulting.
EPAM has used its software engineering expertise to become a leading global provider of digital engineering, cloud and artificial intelligence-enabled transformation services, and a leading business and experience consulting partner for global enterprises and ambitious start-ups. We address our clients’ transformation challenges by fusing EPAM Continuum’s integrated strategy, experience and technology consulting with our 30+ years of engineering execution to speed our clients’ time to market and drive greater value from their innovations and digital investments.
p. 5 · Read in context →
Global Delivery Model — p. 9 · Read the full section →
EPAM's cost engine is where its engineers sit; this is the post-war rebalance to an India-led footprint with Ukraine still core.
Delivery headcount by location: India now largest (~12,200); Ukraine ~8,750; Poland/Belarus/Mexico behind.
In 2025, India remained our largest delivery location, measured by the number of delivery professionals, and as of December 31, 2025, we had approximately 12,200 delivery professionals in this location. We continued to focus on growing India as a key delivery location and added approximately 2,150 delivery professionals since December 31, 2024.
Ukraine continues to be a significant delivery location for us and we had approximately 8,750 delivery professionals there as of December 31, 2025, compared with 8,764 delivery professionals as of December 31, 2024. […] Our other large delivery locations are Poland, Belarus and Mexico with approximately 5,050, 3,400 and 2,950 delivery professionals, respectively, as of December 31, 2025.
p. 9 · Read in context →
Human Capital — p. 11 · Read the full section →
In a services business people are the product; headcount and utilization are the operating levers that drive margin.
~62,850 employees (~56,600 delivery); delivery utilization ~76.8% in 2025.
As of December 31, 2025, 2024 and 2023, we had approximately 62,850, 61,200, and 53,150 employees, respectively, of which approximately 56,600, 55,100, and 47,350 were delivery professionals, respectively. […] For the years ended December 31, 2025, 2024 and 2023, the utilization rates of our delivery professionals were approximately 76.8%, 76.7%, and 74.3%, respectively.
p. 11 · Read in context →
Item 1A. Risk Factors — Risks Related to Geopolitical Events — p. 14 · Read the full section →
The company-defining exposure: ~14,100 people in Ukraine and Belarus, both in a war zone, with clients able to block delivery from there.
~14,100 delivery, administrative and support personnel based in Ukraine and Belarus.
We have significant operations and personnel in Ukraine and Belarus. Ongoing conflict and disruption in the region following Russia’s invasion of Ukraine in February 2022 has had and could continue to have a material adverse effect on our operations, personnel, business, clients, service delivery, and financial results.
In particular, as of December 31, 2025, approximately 14,100 of our global delivery, administrative and support personnel were based in Ukraine and Belarus, both of which are involved in or affected by Russia’s invasion of Ukraine.
p. 15 · Read in context →
Item 1A. Risk Factors — Risks Related to Artificial Intelligence — p. 16 · Read the full section →
The existential question for IT services: AI tools that let clients build software themselves — a risk management ties to the stock price.
AI-based tools as substitutes for EPAM's services — a risk management ties to the share price.
Increased competition, or the perception of increased competition, from new and non-traditional market participants like AI-based task-specific tools, has negatively impacted the price of our stock. If a significant number of our existing or future clients employ AI-driven tools as a replacement for our services or the software we build, our revenues, anticipated growth and prospects, our financial condition, and our results of operations could be materially adversely affected.
p. 16 · Read in context →
Item 7. Management's Discussion and Analysis — p. 41 · Read the full section →
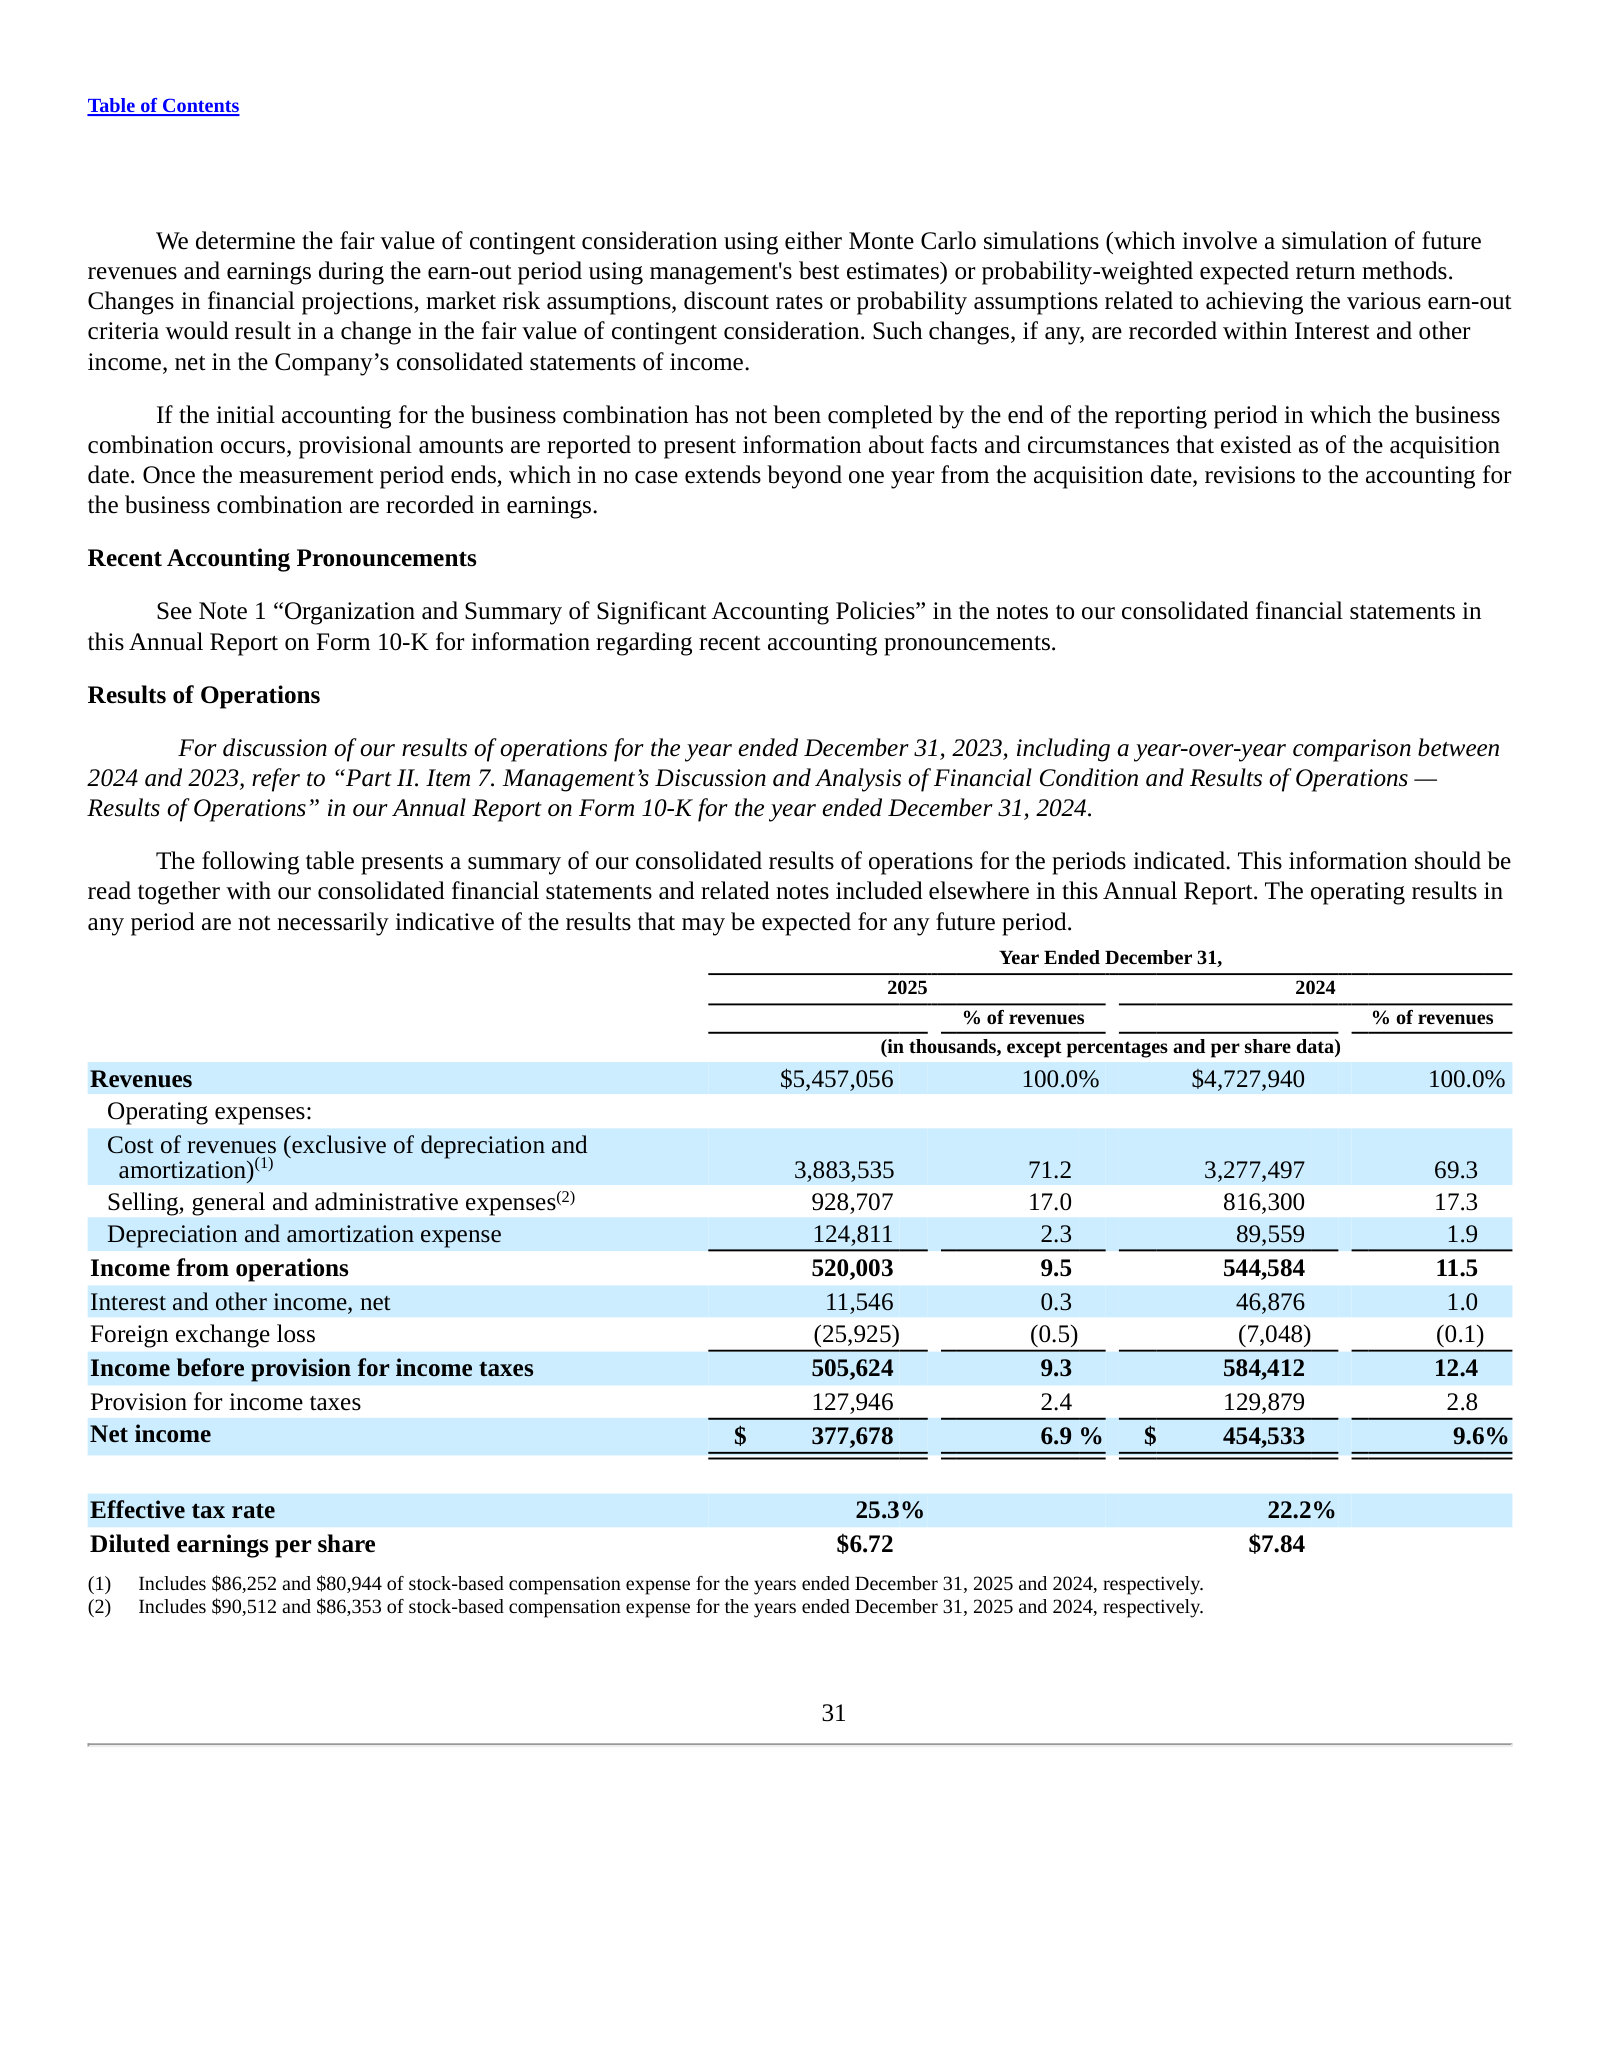
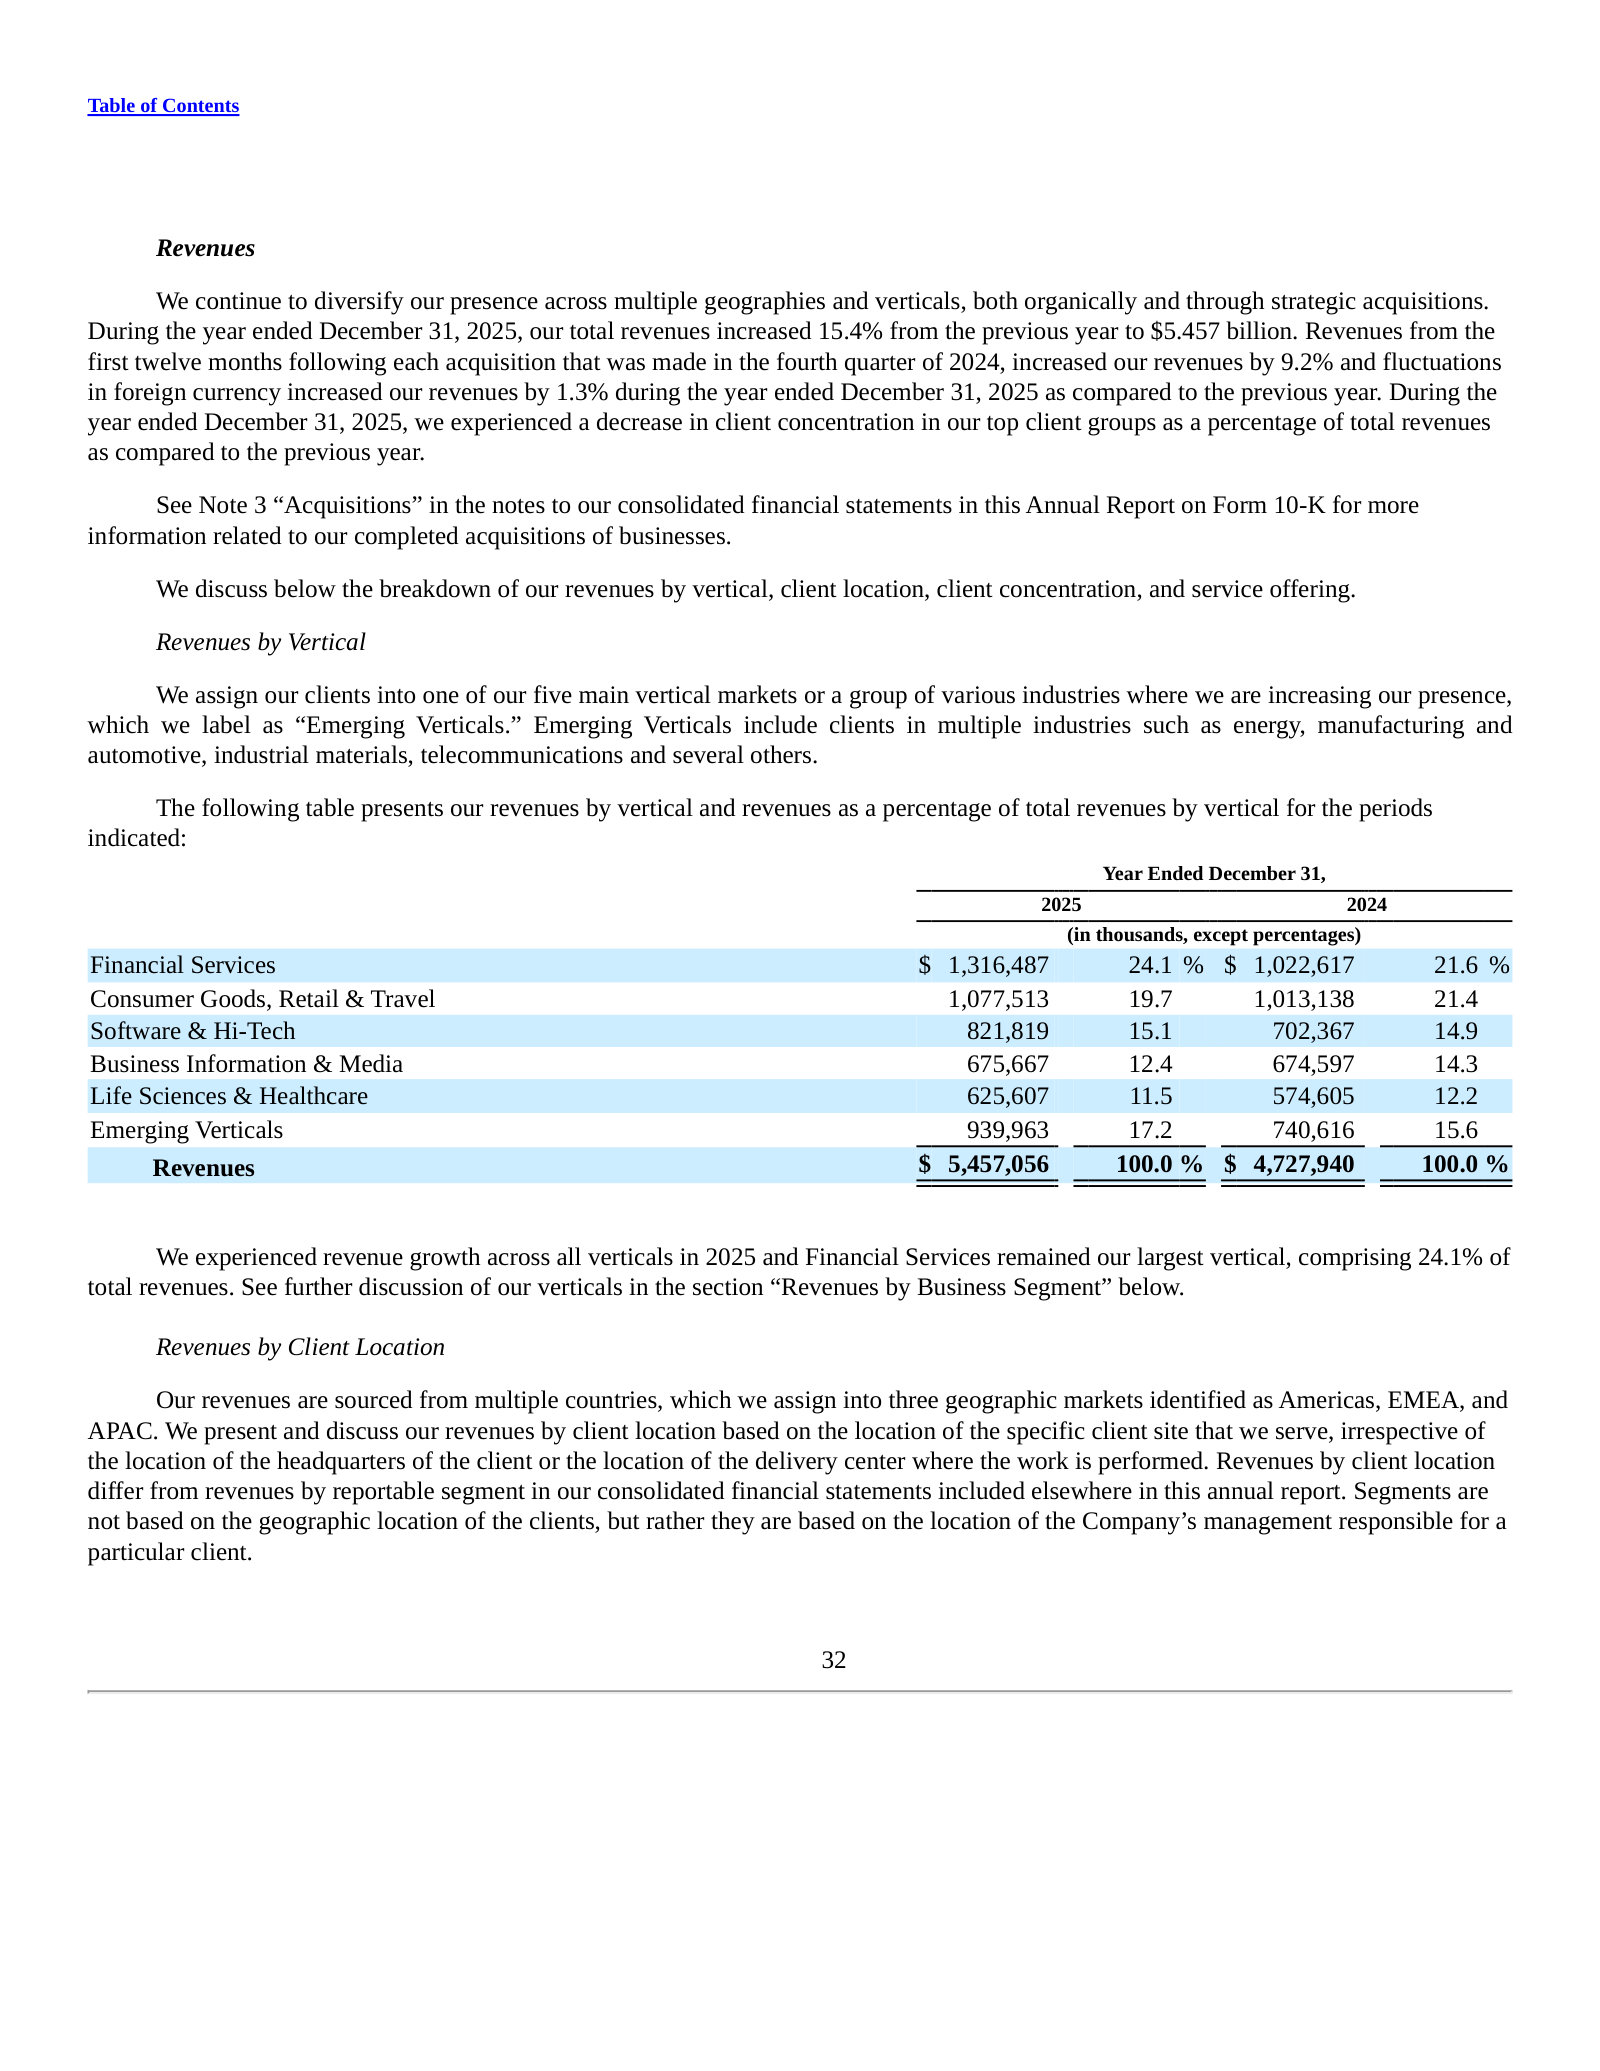
Where management explains what moved 2025: 15.4% growth that was largely acquisition- and FX-driven, against a falling operating margin.
2025 revenue rose 15.4% to $5.457B, but ~9.2pp came from acquisitions and 1.3pp from FX.
During the year ended December 31, 2025, our total revenues increased 15.4% from the previous year to $5.457 billion. Revenues from the first twelve months following each acquisition that was made in the fourth quarter of 2024, increased our revenues by 9.2% and fluctuations in foreign currency increased our revenues by 1.3% during the year ended December 31, 2025 as compared to the previous year.
p. 45 · Read in context →
Item 7. MD&A — Results by Business Segment — p. 49 · Read the full section →
The segment view shows where growth and margin actually came from: Americas softening while Europe re-accelerated.
Americas operating profit fell 3.6% on 2024-acquisition dilution, lower Poland R&D incentives, FX and higher variable comp.
During 2025 as compared to 2024, Americas segment operating profits decreased $19.3 million, or 3.6%, to $522.1 million. […] This decrease is primarily attributable to the impact of lower profitability from acquisitions completed in 2024, lower government incentives related to conducting R&D activities in Poland, changes in foreign exchange rates, and an increase in variable compensation expense as a percentage of segment revenues during 2025 compared to 2024.
p. 50 · Read in context →
EPAM Systems, Inc. — FY2021 Annual Report (Form 10-K) — FY2021
Filed the day after Russia invaded Ukraine, it captures the pre-war delivery base the FY2025 report shows dismantled. · Open the full document →
Global Delivery Model — p. 9 · Read the full section →
The before picture: EPAM's three largest delivery centers were Ukraine, Belarus and Russia — then judged unaffected by regional risk.
More annual reports
EPAM Systems, Inc. — FY2024 Annual Report (Form 10-K) — FY2024 · 113 pages · The year of the NEORIS and First Derivative acquisitions that drove much of FY2025's reported growth. · Open →
EPAM Systems, Inc. — FY2023 Annual Report (Form 10-K) — FY2023 · 114 pages · The demand-slowdown year management repeatedly points back to when explaining uneven growth. · Open →
EPAM Systems, Inc. — FY2022 Annual Report (Form 10-K) — FY2022 · 102 pages · The first full-year report after the invasion, documenting the exit from Russia and the start of the delivery rebalance. · Open →